Showing posts with label statistics. Show all posts

Thursday, July 17, 2025

Highlights from our Monthly Reports

 San Francisco Market Analysis

The average selling price in June for all single family homes in San Francisco fell to $2,131k compared to $2,417k in May.  The number of sales, days-on-market, and premium were mostly unchanged.

The premium (selling price vs listing price) for a 2 bedroom, 1 bath single family home was down from $118k to $114k.  The number of sales was down to 21 in June from 31 the previous month. The avgerage selling price was down 3% to $1,224 from $1,265 the previous month

The number of sales of 3 bedroom, 2 bath single family homes was unchanged.  The average selling price was down to $1,622k compared to $1,803k the previous month.  The premium rose to 117% compared to 113% in May.

For condos, average selling prices were down across the board compared to May while days-on-market have increased. The number of units for sale is up except for 2 bedroom, 2 bathroom units.

Overall, condo inventory (units on the market) is down by 23% compared to May.  For single family homes inventory is down 18% compared to May.

 Condos vs TICs

In the first six months of the year TICs sold for $66k - $175k less than a comparable condo.  The exception is 1 bedroom, 1 bath units where TICs are selling for $41k more than the comparable condo.

 San Francisco Fundamentals

Compared to a year ago, the average selling price of a 2 bedroom, 1 bath single family home dropped $147,000 ($1,224,000 vs $1,371,000).  In June 2025 buyers paid 14% over asking compared to 24% over asking in June 2024.

Also compared to a year ago, the number of condo sales was up 33%.  Average selling prices were down slightly by $4,000 although 2 bedroom, 2 bath condos sold for $109,000 more in June 2025 than a year ago ($1,265,000 vs $1,156,000).  

Friday, May 23, 2025

Highlights of monthly reports for April

Single Family Homes in San Francisco

Compared to March:

  • 2/1 single family home sales about the same number as March.  Avg selling price was down slightly.  DOM up slightly.  Premium down slightly to 119% of asking price.
  • 3/2 single family homes -- big jump in number of sales -- 52 (double compared to March).  Avg selling price down 6%. DOM dropped to 16 compared to 21 the previous month.
  • All sales of single family homes: 214 compared to 177 in March (up over 20%); avg selling price down 11%; DOM up to 23 compared to 20 in March.

All Residential Sales

Compared to a year ago:

  • Total number of residential sales (single family homes, condos, TICs, co-ops) was down 5% compared to April last year.  But sales are up 5% for the first four months of the year compared to the same period last year.  
  • Overall, residential sales are currently at pre-pandemic levels.  
  • Average sales prices for 3/2 single family homes was $1,648k in April, 8% below the all time high in 2022 of $1,773k.  (The average selling price of all single family homes in April was $2,164k -- a reminder to be cautious when talking about average selling prices).

Condos/TICs in San Francisco

  • 46 1/1 condos/TICs sold in April, the same as March with an average selling price of $747k -- 12% higher than March but still well off the high average selling price in 2019 which was $871k.
  • 64 2/2 condos/TICs sold in April, up slightly from March, but with an average selling price of $1,244k which was lower by 3% compared to March.  The highest average selling  price for 2/2 condos was achieved in 2019 at $1,463k.


Monday, September 23, 2024

Highlights from August sales reports

The number of new listings jumped significantly in the two weeks ending 9/16/24 -- compared to the previous two week period new listings of single family homes rose 78% from 125 to 222; condos went from 147 to 396 (169%).  The total number of new residential listings was 618, about the same as last year in the same two week period, 685.

Not surprisingly, the number of price reductions rose for single family homes from 17 to 35 and for condos from 42 to 86.

Traditionally, we always see a notable increase in listings every year right after Labor Day.  And keep in mind last year we had just experienced a two and a half week period in August when the MLS was not available.

The average sales price for a two-bedroom, one-bath single family homes so far this year is up about 3% compared to last year ($1,219,000 vs $1,180) but still below the all-time high of $1,339,000 in 2021.  Similarly for three-bedroom, two-bath single family homes, the average sales price so far this year is $1,626,000 which is almost 5% higher than last year but still off from their all-time high of $1,773,000 in 2022.

The average sales price for one-bedroom, one-bath condo so far this year is $721,000 which is about 2% higher than last year and is the first year-over-year gain following four years of average sales price declines.  However, the current average sales price is off 17% compared to the peak of $871,000 in 2019.

Similar story with two-bedroom, two-bath condos with an average sales price so far this year of $1,255,000 which is 3% below last  year's average and 14% off the average sales price in 2019 of $1,463,000.


Wednesday, January 24, 2024

A Market Update through December

Our regular reports have been updated to include December sales results.  During our office meeting today we  discussed some of the highlights.  Here are my notes:

”Existing home sales hit its lowest level last year since 1995, according to a report from the National Association of Realtors”

San Francisco’s version of this quote:  existing home sales were the lowest we’ve had going back as far as my records go – 2005.  Total residential (not residential income, multi-unit) sales were 3,858.  The previous low was in 2008 when 4,334 units sold.

Residential income property sales (2, 3, and 4-units) 474 – the lowest in 10 years except for 2020 which was 444.  On average 638 residential income properties sell.  The same profile shows up in the 5+ unit category.  110 sales in 2023, the lowest except for 2020 when sales were 93.

I also consulted ChatGPT which told me:

“I don't have real-time data or updates for the year 2023. For the most accurate and recent information on the residential real estate market in San Francisco in 2023, I recommend checking reliable sources such as real estate reports, market analyses, or news articles from that time. Market conditions can change rapidly, and up-to-date information will provide a more accurate picture of the trends, pricing, and overall dynamics in the San Francisco real estate market during the specific period you're interested in.”

 New Listings and Price Reductions 


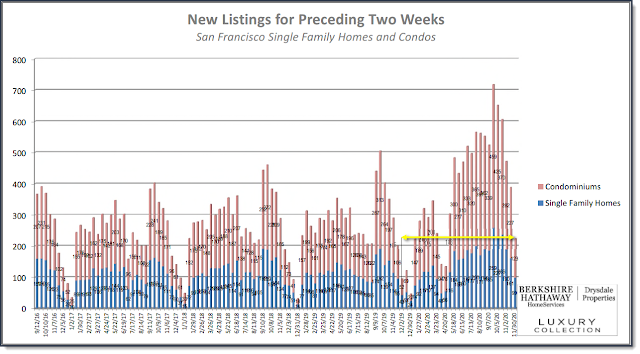
The graph above shows new listings in two week increments going back to 2017.

·       There was a big jump in new condo listings in the last two weeks which we expect each year immediately following the holidays (rain, shine, recession or pandemic).  264 compared to 83 in the prior two week period.  265 for the same period last year and compared to 147 in 2020 (pre pandemic). 

·        Single family homes increase was not quite as dramatic.  127 new listings compared 43 in the prior two week period.  99 a year ago and compared to 74 in 2020 (pre pandemic).

·       


The number of price reductions are about the same as last year – 16 for single family homes and 38 for condos.  Pre pandemic price reductions were 5 and 12.

Inventory 


The number of active listings (especially condos) exceeded monthly sales in every month in 2023 in a much wider gap between listings and sales than pre-pandemic.  

·       Basically, there are plenty of listings but not enough buyers.


Sales Prices

·        These two graphs tell the story.


We survey five different configurations of single family homes and condos.

o   2 bed, 1 bath single family homes sales prices have gone down 12% from their high in 2021 of $1,339 to $1,180 in 2023 a number not seen since 2017. 

o   3/2 single family homes have also gone down 12% in just one year from their high in 2022 of $1,773 down to $1,553 (back to 2018 levels).

o   1/1 condos average selling price in 2023 was $708, down 19% compared to their high of $871 in 2019.  Annual average selling prices have gone down each of the past four years.

o   2/1 condos are down 14% from $1,174 high in 2019 to $1,011 in 2023. 

o   2/2 condos are down 12% from $1,463 in 2019 to $1,293 in 2023.

·  Similar reductions  in average selling prices for multi-unit properties.

o   2-units down 12% from their high in 2021 ($1,962 vs $2,221)

o   3-units down 15% from their high in 2018 ($1,996 vs $2,328)

o   4-units down 13% from their high in 2021 ($1,882 vs $2,159)

TICs 

·        Currently, there are 400+ active listings with price differentials between TICs and similarly configured condos ranging between $48k for 1 bedroom units to $300k+ for 2bd/2ba units.

Those differentials hold for average sales prices with the range being $18k for 1bd, $220k for 2bd/1ba, and $209k for 2bd/2ba. 

Thursday, October 13, 2022

Has sanity returned to the San Francisco residential real estate marketplace?


September ends a very slow third quarter for closed residential sales.  There were 1,815 single family homes that closed and 2,466 condos/TICs.  Compared to the third quarter of 2021 single family home closed sales declined 15%, condos/TICs declined 25% and total combined residential sales declined 21%.

Inventory continues to build following the Labor Day holiday weekend as it does most years.  Single family homes have an inventory of about two months supply and condos/TICs show an almost three month supply.  Of the 432 currently active single family homes 138 of them, almost 32%, are priced at or above $2.5 million.

Average selling prices continue to moderate downward.  While single family homes remain at historic highs they have been declining in recent months.  Days on market are increasing and overbidding is declining.  All of which means lower average selling prices.  And, as we approach the 7% mortgage interest rate level, this will probably dampen sales even further.

Active buyers are finding plenty of available inventory.  Competition has dwindled and, in many cases, disappeared.  Negotiating is back on the table.  DOM continue to increase.  While some overbidding continues in a few “pockets of popularity”, offer dates have largely disappeared and the few we’ve seen have not succeeded in generating accepted offers.

Wednesday, September 7, 2022

Taking Stock of the Post Labor Day Market

 The San Francisco residential real estate market remains quite active even though new inventory coming onto the market has slowed to numbers we usually don’t see until December.  There remains about four weeks of available single family home inventory as of 9/5/22 and condos/TIC inventory about eight weeks.  In addition there are 84 single family homes and 154 condos/TICs in the “coming soon” category.

Comparing closed sales for the first eight months of this year vs 2021 single family homes have declined by 14% and condos/TICs declined by 24%.  Overall residential sales declined by 20%.

Historic high average selling prices remain for single family homes priced below $2.75 million.  However, the condos/TICs segment has moderated.  For 1/1, 2/1 and 2/2 configurations* we survey each remains off their historic highs established in 2019.  1/1’s have gone from $871k to $824k,  2/1’s from $1,174k to $1,168k, and 2/2's from $1,463k to $1,429k (-5.4%, -0.6%. and -2.3% respectively).

This new market has much to offer for buyers and sellers.  Inventory remains relatively stable and consistent – 1 month for single family homes and 2 months for condos/TICs.  Rising interest rates typically means less competition and generally selling prices closer to list prices with offers that contain more conditions and more back and forth negotiations.

Also of note, in the last two months there has been an unusually large number of listings that have been withdrawn particularly in the $1million-$1.5million price range.


*bedrooms/baths

Tuesday, July 12, 2022

First six months 2022 vs 2021


The number of San Francisco residential closed sales, including single family homes and condos/TICs, for the first six months of 2022 are down 17% compared to the first six months of last year (2021).  Single family homes are down by 11% and condos/TICs are down by 22%

Reviewing the five configurations we survey monthly 2/1 (bedrooms/bathrooms) and 3/2 single family homes had an increase of 7% for 2/1s and a 4% decrease.  Of the 1/1, 2/1 and 2/2 condos/TICs it’s quite a different story.  1/1s are down 23%, 2/1s are down 36% and 2/2s are down 16%.

At the same time the average selling price shows an increase in all five categories we survey.  2/1 single family homes are up 6%, 3/2 single family homes are up 10%.  For all single family homes regardless of configuration that closed in the first six months are up 1% on average.  Condos/TICs also saw increases in average selling prices for every configuration we survey, 1/1, 2/1 and 2/2 increased by 2%, 2% and 5% respectively.

Inventory continues to increase as is normal for this time of year.  There is approximately 5 weeks of single family homes currently available and 11 weeks for condos/TICs. 

These statistics are based on MLS listings.  New construction units are generally not included (except for sample units) so available inventory of condos is more likely to be in the 3-4 month range.

In our 24 years of keeping stats on SF real estate there has never been this high a number of available condo/TIC units.

Tuesday, June 7, 2022

Reviewing First Five Months of 2022

The number of San Francisco residential closed sales through May 31 of this year shows a decline of 15% with single family homes down 7% and condos/TICs down 19% when compared to the first five months 2021.  (2021 was the best year for total sales since 2004).

Demand for single family homes remains strong and average selling prices remain at historic highs for 2bed/1bath and 3bed/2bath configurations we survey monthly.  In the last three months each configuration has shown a decline in the average selling prices – 2/1s by 5% and 3/2s by 12%.

For the three configurations we survey of condos/TICs, 1/1s are down 9%, 2/1s down 7% and 2/2s down 9% over the last three months.

As of 6/6/22 there is approx. 6 weeks of available inventory for all single family homes and about 11 weeks for all condos/TICs.

Much of the decline in selling prices could be anticipated given the number of available properties.  For example, our condo/TIC inventory has reached about 11 weeks which does not include new construction inventory which is not usually listed in the MLS.

However, average sales prices for single family homes become less predictable even as the inventory increases.  It could be the decline in average selling prices may be the result of rising interest rates or, perhaps, buyers’ agents are advising against making aggressive offers.

34% of single family homes that closed this year through 5/31/22 sold at or above $2.5 million.  4% closed at or below $1 million.  15% of the condo/TICs closed at or above $2 million while 35% closed at or below $1 million.

Tuesday, May 17, 2022

Inventory may be low but sales continue to boom

As buyers agents we're routinely bemoaning the lack of inventory.  But sometimes it's worth taking a high level view of sales.

By most measurers, last year (2021) was a boom year for residential sales in San Francisco with over 7,300 units changing hands -- the highest number we've recorded in the 16 years we've been keeping records.  The prior three years (2018-2020) total sales were in the 5,200-5,300 range, 28% below 2021.


To get a closer perspective on how we're doing so far this year here is a graph comparing the first four months of 2022 to the same period for previous years.

With the exception of 2021, the first four months this year have seen more sales than any of the years back to 2006.  Climate change (earlier spring market)?  Afraid of missing out on historically low interest rates?

Will this trend last for the rest of the year?

Tuesday, November 16, 2021

New Listing Market Watch and 3-county report

 Our bi-weekly New Listing report shows a further decline in new listings over the past two weeks compared to the previous two week period.  A decline in new listings is typical (and highly predictable) for this time of year and will continue until after New Years if this this year follows.

New single family home listings were 140 compared to 166 in the prior two week period.  Condos were 199 compared to 259 in the prior period.  Compared to a year ago new listings of single family homes was 140 in the last two weeks compared to 161 a year ago.  For condos the 199 new listings this year compares to 227 a year ago.


On our 3-County report the same drop in active listings can be seen.  In San Francisco the total number of active, in contract, and pending listings is down 90 compared to a week ago (1,801 compared to 1,891).  A similar decline can be seen in the numbers for Marin and Sonoma counties as well.


The full reports can be seen at our web site.


Wednesday, October 13, 2021

A look back over the last 3 quarters

 Our San Francisco residential real estate market for the first three quarters of 2021, in spite of all the COVID issues, is having one of the best years in the last 10 for total sales.  Reviewing the variety of reports we do there are a few items that stand out.

For single family homes 53% (1,130 units) of closed sales in the first three quarters had average prices between $1 and $2 million.  Another 15% (322 homes) closed between $2 and $2.5 million.  Followed closely by 275 homes (13%) between $2.5 and $3 million.

Similarly, in the first three quarters of 2021 52% of condos/TICs sales (1,670 units) were between $1 and $2 million.  The next largest group, 18% (582 units) was between $800k and $999k.  16% (536 units) closed between $500k to $799k.

Inventory continues to be plentiful for condos/TICs.  As of 10/10/2021 there was approx. 3.8 months of available inventory (911 units) with an additional 105 in contract and 320 units pending.

It’s a more mixed message for single family homes where there were 325 active listings with 35 in contract and 285 currently pending.  This represents about 1.6 weeks of inventory.  For the two configurations that we track (2 bedroom, 1 bath and 3 bedrooms, 2 baths) there is 4 weeks and 5 weeks of inventory.

Average selling prices for 2/1 and 3/2 single family homes continue at record highs with 2/1 homes averaging $1.33 million and 3/2 averaging $1.75 million.

Annual average selling prices for the three configurations of condos/tics we track (1/1, 2/1 and 2/2) are $825k, $1.14 million and $1.41 million respectively.  These averages are down 5%, 3% and 4% compared to previous highs reached in 2019.

As might be expected, with almost 3.8 months of inventory, these average selling prices will be constrained through the end of the year. 

By the way, TICs as a percentage of condo/TICs sales is now about 6% -- the lowest percentage since 2002.  In most years TICs make up 8-10% of the combined condo/TIC market.  This reduction in market share seems to be mostly the result of the large influx of condo inventory in the past 2-3 years.

Monday, September 20, 2021

Big Uptick in New Listings

In a “normal” year the 14-day period following Labor Day brings one of the largest increases of new inventory coming onto the San Francisco residential real estate market.  This year was no exception with 281 single family homes and a whopping 536 condos/TICs having been added.


Compared to the previous 14-day reporting period there were 147 single family home and 187 condos/TICs added.  That’s a 91% increase in single family homes and 187% increase for condos/TICs. 

For a similar 14-day period in 2020 there were 250 single family homes and 459 condos/TICs that were added.  That is an 8% increase for single family homes and 17% increase for condos/TICs.

The influx of new inventory into our market will provide buyers with more opportunities with about 1.6 months of available inventory for single family homes and 3.6 months of inventory for condos/TICs.  And with such a large number of available listings it has also brought 30 price reductions in single family homes and 78 price reductions in condos/TICs.

If the pace of sales holds we are on track to have the largest number of closed sales since 2013.

The full report can be found on our web site.

Monday, August 30, 2021

Signs of Typical Fall Inventory Uptick

 Heading into the Labor Day weekend we're seeing signs of the usual increase in inventory typical in early September. 

As you can see from this overly busy graphic, the number of active listings increases in September, October and early November every year regardless of recession or pandemic. (These numbers are calculated in the first week of each month.  When Labor day falls in the latter part of the first week of September the increase in listings doesn't show up until the early October figure).

The other indication is the increase in "Coming Soon" listings in the MLS.  In San Francisco the number of "coming soon" listings has increased from 170 to 196 in just seven days.  Most of the "coming soon" listings are condos -- 136 compared to 120 a week ago.  "Coming soon" single family home listings increased to 60 compared to 50 a week ago.


Tuesday, August 3, 2021

Active Listing Down -- Closed Sales Up

 Active listings as of 8/2/21 in San Francisco dropped approximately 9% compared to the prior week (900 compared to 957).  The percentage drop was the same for both single family homes (257 compared to 287) and condos (643 compared to 670).

The number of closed sales of single family homes in July was approximately the same as July 2020 (235 vs 237).  Condos was a different story with 330 closed sales compared to 274 a year ago -- a 20% increase.

The full report can be found in the "3 County Comparison Report" on our website which includes data for San Francisco, Marin and Sonoma counties:

http://www.boldsf.com/Statistics%20test/Statistics.html


Wednesday, June 9, 2021

Low Inventory of single family homes

There’s barely a month of inventory of single family homes in both San Francisco and Marin.  Sonoma is doing better with nearly 2 months of inventory.  San Francisco and Sonoma have 64 and 51 single family homes “coming soon”.  Marin has 11.

Marin Fundamentals (May compared to April)

(click on heading to see the full report)

Number of sales in May was down 8% for single family homes and 12% for condos.

Average selling prices were down 7% and condos were up 3%.

Active listings are up 35% for single family homes and 7% for condos.


San Francisco Fundamentals (May compared to  April)

(click on heading to see the full report)

Number of sales of single family homes was down 11% but basically unchanged for condos.

Average selling prices were up 4% for single family homes and up 2% for condos.

Active listings are up 10% for single family homes and 2% for condos.

Market so far in 2021`

Based on the Total Number of Closed Sales through May 31st, the San Francisco residential real estate market remains on track to be among the best in the last 10 years.

By way of historical perspective, in 2013 closed sales for single family home through May 31st totaled 1,052 and condos/TICs added an additional 1,350.  This year through the end of May single family home sales totaled 1,090 (a 4% increase over 8 years) and condos/TICs show closed sales of 1,827 (an increase of approx. 35%).


Available inventory of single-family homes continues to be between 2 and 4 weeks for homes under $3 million.  Available inventory for homes priced above $3 million is running between 2 and 4 months.

Inventory of condos priced below $2.5 million is between 2.5 and 3 months. Condos priced above $2.5 million inventory is 5+ months.

Based on average selling prices for single-family homes that we survey monthly (2 bedroom, 1 bath homes and 3 bedroom, 2 bath homes) continue to set historic highs almost every month.  For condos/TICs average selling prices have moderated for the three configurations we survey (1 bed/1 bath, 2 bed/1 bath, and 2 bed/2 bath).  Prior historic highs were all established in 2019. 

1 bed/1 bath prior historic average selling price was $871k.  Through May 31st it is now $814k (a 7% reduction).

2 bed/1 bath prior historic average selling price was $1,174k.  Through May 31st it is now $1,129k (a 4% reduction).

2 bed/2 bath prior historic average selling price was $1,463kk.  Through May 31st it is now $1,386k (a 5% reduction).

Sunday, March 14, 2021

Spring Market (already)

 Our spring residential real estate market has started early and continues strong.  Single family homes added 174 listings in the last 14-day reporting period; 53% higher than the same 2-week period in 2020.  Compared to the previous 14-day period single family homes new listings went from 141 to 174, a 25% increase.

Condos/TICs saw an increase compared to the same 14-day period last year of 73% from 172 to 308.  Our prior 14-day period saw a very slight decrease from 311 to 308, a 3% decrease.

As of 3/10/2021 there was approximately 12 weeks of available inventory for condos/TICs and there are 109 in the “coming soon” category.

The average selling price for the five configurations we survey each month shows that 2 bedroom, 1 bath and 3 bedroom, 2 bath single family homes saw an increase in average selling price of 15% for the 2/1s and 3% for 3/2s compared to the previous month.

1/1 and 2/1 condos/TICs each saw an 8% increase in average sales price while 2/2 condos/TICs saw a 2% decrease compared to the prior month.

We also analyze residential sales by price range.  One revealing item shows up when comparing the number of single-family homes sold in 2019 vs 2020.  In the price range from $1 million to $2.5 million total sales for single family homes made up 68% of all sales in 2019 but jumped to 71% in 2020.

73% of condos/TIC sales were in the range from $800k to $1.5 million in 2020, virtually unchanged from 72% in 2019.  Another 14.5% showed up in the $500k-$799k range in both 2020 and 2019.

The full reports are available at our blog:  www.boldsf.com/Statistics

Or the individual reports:

Bi-weekly Market Watch

San Francisco Sales by Price Range


Tuesday, February 9, 2021

New Listing Market Watch - early February

Has the spring market begun?  In the last two weeks there were 448 new residential listings in San Francisco compared to just 264 for the same period in 2020.  Just over 300 were condos/TICs -- double the number in 202.  There were 147 new listings of single family homes compared to 108 a year ago -- a 36% increase.

Compared to the prior 2-week period ending 1/25/2021 new listings of single family homes jumped from 98 to 147.  Condos fell slightly from 316 to 301 new listings.


There were 23 price reductions of single family homes and 57 price reductions of condos.  Both of those numbers are more than double compared to the same period last year (10 and 24 respectively). We haven't seen that many price reductions since just before the Thanksgiving holiday.


Tuesday, December 22, 2020

Last New Listing Market Watch before Christmas

Since July our residential real estate market has rebounded and indicates there is continued demand for San Francisco single family homes and condos. While demand remains relatively constant compared to last year, inventory is very different story.  Still too few single family homes and too many condos/TICs.  During the last 14-day Hot Sheet periods, the number of listings of single family homes is up 9% compared to the same period in 2019 while condos/TICs listings are up 142% compared to the same period in 2019.

Compared to the previous 14-day period single family homes are the same at 99.  Condos are up by 36% (123 to 167 units).  We still expect the 4th quarter will see the best quarter of 2020 in actual closings.

Average selling prices are falling for most configurations of homes that we survey with the notable exception of 3 bedroom, 2 bath single family homes which are averaging about 3% above 2019. 

It is also evident that, as usual, many units are being withdrawn presumably for at least 30 days and will reappear in the new year as “coming soon” or active with zero days on the market.

For the full report go to our website .


Tuesday, December 1, 2020

Post Thanksgiving; Pre Christmas

New listings coming onto the San Francisco residential real estate market in the last two weeks has reverted in some ways to "normal".  Normal in the sense that during the last 14 days the number of new single family home listings has declined by 39% compared to the prior two week period and condos/TICs declined by 46%.  Regardless of what the economy is doing every year we always see this kind of decline from Thanksgiving until after the new year.

But compared to the same period a year ago the number of new single family home listings coming on the market is up 130% and condos/TICs are up 131%.  So, not so normal.


Data also shows the number of sales for November (through 11/29) is up 10.4% compared to November last year.  (Single family homes are up 16% and condos/TICs are up 7%.


The number of price reductions in the last 14 days are the lowest since July, 2020.  There were 21 price reductions of single family homes and 79 reductions of condos/TICs.


The full reports can be found at our website.