Showing posts with label annual statistics. Show all posts

Sunday, January 15, 2023

December and 4th Quarter Recap

This week we posted our regular monthly and quarterly reports for 2022 as well as our biweekly New Listing Market Watch report.  Here are some highlights (lowlights?).

NewListing Market Watch

  • ·       Single family new listings: 94 in 2021, 64 in 2022, 42 this year.
  • ·       Condo new listings: 241, 151, and 84


Fundamentals

  • ·       Sales in December down compared to November (typical for this time of year)
  • ·       Average selling prices are down compared to November, -2% for single family homes and 22% for condos.  Compared to December a year ago average selling prices are down 22% for single family homes and 24% for condos.
  • ·       Inventory is up over 50% for single family homes compared to a year ago, and 7-8% for condos.


By PriceRange

  • ·       Premiums for the year compared to 2021 were steady at 112% for single family homes and 103% for condos. 

  • ·       BUT, for the last six months premiums dropped for single family homes to 105% and for condos to 100%.  (By comparison for the last half of 2021 premiums were 112% for single family homes and 105% for condos).


Quarterly

  • ·       For the five configurations of single family homes and condos we track, the number of sales and average sales prices were down across the board.

Monday, November 7, 2022

Where are the buyers?

What a difference a year makes in the San Francisco real estate market.  2021 was the best year for total closed sales since 2004, including the fourth quarter.  The fourth quarter usually vies with the first quarter in a typical year for the fewest sales.  Yet in 2021 it turned out to be the second best quarter after our second quarter spring market.

The 2022 fourth quarter has started out very slowly.  The single family home segment is still showing demand but rising interest rates are affecting even that portion of the market with moderating final selling prices, disappearing offer dates, and fewer buyers overall.

The condo/TIC segment has seen an almost 25% drop in closed sales compared to 2021 with falling average selling prices, increasing days on market, price reductions, and withdrawals.  Available inventory remains almost three months.  Most of us would call this a “buyer’s market” which hasn’t been part of our vocabulary since 2010.

Single family homes average selling prices remain at historic highs for properties priced below $2.5 million, but there are signs of downward moderation.  For the 1/1, 2/1, and 2/2 condos we survey average selling prices are down by 6%, 2%, and 3% compared to previous historic highs established in 2019.

The numbers indicate a slowdown is here.  Sellers are slowly adjusting to that realization.


Wednesday, October 13, 2021

A look back over the last 3 quarters

 Our San Francisco residential real estate market for the first three quarters of 2021, in spite of all the COVID issues, is having one of the best years in the last 10 for total sales.  Reviewing the variety of reports we do there are a few items that stand out.

For single family homes 53% (1,130 units) of closed sales in the first three quarters had average prices between $1 and $2 million.  Another 15% (322 homes) closed between $2 and $2.5 million.  Followed closely by 275 homes (13%) between $2.5 and $3 million.

Similarly, in the first three quarters of 2021 52% of condos/TICs sales (1,670 units) were between $1 and $2 million.  The next largest group, 18% (582 units) was between $800k and $999k.  16% (536 units) closed between $500k to $799k.

Inventory continues to be plentiful for condos/TICs.  As of 10/10/2021 there was approx. 3.8 months of available inventory (911 units) with an additional 105 in contract and 320 units pending.

It’s a more mixed message for single family homes where there were 325 active listings with 35 in contract and 285 currently pending.  This represents about 1.6 weeks of inventory.  For the two configurations that we track (2 bedroom, 1 bath and 3 bedrooms, 2 baths) there is 4 weeks and 5 weeks of inventory.

Average selling prices for 2/1 and 3/2 single family homes continue at record highs with 2/1 homes averaging $1.33 million and 3/2 averaging $1.75 million.

Annual average selling prices for the three configurations of condos/tics we track (1/1, 2/1 and 2/2) are $825k, $1.14 million and $1.41 million respectively.  These averages are down 5%, 3% and 4% compared to previous highs reached in 2019.

As might be expected, with almost 3.8 months of inventory, these average selling prices will be constrained through the end of the year. 

By the way, TICs as a percentage of condo/TICs sales is now about 6% -- the lowest percentage since 2002.  In most years TICs make up 8-10% of the combined condo/TIC market.  This reduction in market share seems to be mostly the result of the large influx of condo inventory in the past 2-3 years.

Wednesday, January 20, 2021

2020 San Francisco Residential Real Estate Market in Review

If you just go by the “numbers” without taking into account the other “issues” that captured all the headlines last year it was a rather normal year for San Francisco residential real estate

Total residential sales for 2020 was 4,967 homes; for 2019 it was 5,023, a mere difference of 56 homes or a decline of .01%.

For the five categories of residential properties we survey each month the average selling prices show some surprising results:

Single family homes remain in high demand.  In December 2/1 and 3/2 homes had DOM (Days on Market) of 17 and 24 respectively and had premiums (selling price ÷ list price) of 111% and 104%.

In the condo/TIC market1/1, 2/1 and 2/2 units had DOMs of 52, 52 and 53 respectively and premiums of 98%, 101% and 98%.

But when you look at our other data, in this case Sales by Price Range, another story emerges.  Single family homes selling for over $3.5 million tend to sit on the market at least twice as long as lower priced homes.  Average days on market for home over $3.5 million is 50 compared to 27 for home priced lower.  In addition, a high percentage of homes listed for over $3.5 million are withdrawn or cancelled – a rate almost three times that of homes priced below $3.5 million.

And the law of supply and demand does still apply.  While current inventory for condos remains unusually high, still about 2.5 months of available units.

Our Condo vs TIC Quarterly Study shows a slight pickup in the number of TICs sold as a percentage of total sold condos+TICs.

As we look at (as of 1/11/2021) our marketplace we have one month supply of available single family homes and over 2.5 months of supply of condos/TICs available.  And waiting for the spring market with 192 units in the “coming soon” status (70 single family homes and 122 condos).  Perhaps this will be a more normal year in real estate.

And a quick review of the last 7 days hot sheet as of this morning shows there were 73 single family homes and 152 condos/TICs added.  Compare that to the prior 14 day period in 2020 when there were 92 single family homes and 189 condos added.  Spring market appears to have arrived with some fast-building inventory.

To see our complete year-end analyses please visit:  www.boldsf.com/Statistics


Wednesday, October 16, 2019

At the Beginning the 4th quarter

The San Francisco real estate market remains strong, especially averages selling prices.

Average selling prices for the five configurations of homes we track (which make up approx 60% of all home sales) continue to be at historic highs with only one exception:


*includes condos, co-ops and TICs


Year over year, the total number of sales fell by 6%; single family homes were down by 3% and condos were down by 7%.

As typical after Labor Day, inventory increased month over month by over 5% while single family homes were down by 10% but condos were up 15%.  The largest inventory increase in our record keeping was back in 2010 when a total of 1,229 single family homes and condos were added to the market.  This year that inventory increase was 665.  During the intervening years the increases were in the 400s to 500s range.

Wednesday, January 23, 2019

Annual Sales Comparison

Contrary to statistics being reported by the National Association of Realtors, the number of residential sales in San Francisco in 2018 increased slightly compared to the previous year:


The increase was 1.8%.  In 2017 the increase was 2.2%.  Prior to that we had three years of a decline in the number of sales year-over-year.

Looking at the comparison of first half to second half of the year, most of the increase in 2018 compared to 2017 was in the first 8 months. 


For the past three years the number of sales in the 2nd half of the year has been declining slightly.

As is typically the case, the number of residential sales in San Francisco always hits its peak in May/June and then again in October.  Not surprisingly, the fewest number of sales happen in January/February and then again in September.  Keep in mind that most sales are recorded on average about 30 days after a property goes into contract.  That's most obvious when we show the lowest number of sales in January because most buyers have other activities occupying their time and attention in December.

Wednesday, January 3, 2018

Annual Residential Sales -- San Francisco and Marin

Both counties showed an uptick in residential sales for 2017 compared to 2016. 


It wasn't a huge increase (2.2% in San Francisco and 3.1% in Marin), but in each case it's the first year-over-year gain in sales in four years.

(Note -- these numbers come from the San Francisco MLS and BAREIS.  They generally do not contain numbers of new construction homes sold during the year.)


Wednesday, July 12, 2017

Sales Are Up but Inventory is Down -- what's going on?

For the first half of 2017 the number of residential sales recorded by the San Francisco MLS is up almost 9% compared to the first half of last year -- 2,533 vs 2,332. 


That's the busiest first half since 2014.

But looking at active listings during the first week of each month it is clear that listings are not keeping pace with sales.

This graph shows active listings at the beginning of each month for years 2010 through2019.  Each year follows roughly the same month-to-month pattern -- low numbers in January building to a peak in May/June followed by a lull in July/August followed by another peak in October and then falling off through the end of the year.  The last three or four years active listings have been very low compared to the four previous years.


This trend can be seen on a monthly basis.  Here we show the number of active listings by the five categories of single family homes and condos we track.


Single family homes (both 3/2 and 2/1)and 2/1 condos show the fewest listings while 1/1 and 2/2 condos have significantly more.

Wednesday, March 8, 2017

Decline in Residential Sales?

Total residential sales (single family homes, condos, TICs, co-ops) in San Francisco as reported by the MLS declined in 2016, the third consecutive year of such declines.

The percentage reduction from the peak of the recovery in 2013 to 2016 is about 16%.  From the height of the real estate market just before the mortgage meltdown and subsequent recession the drop was more than 25%.

Since we haven't had a financial collapse recently we need to look for other reasons to understand the decline.  In no particular order here are some possible explanations:

  1. The pent up demand from the recession has worked its way through the market;
  2. There is a large number of new construction condos that have come on the market in the last several years.  (Most new construction condos do not appear in the MLS and are not included in the sales totals above).

Tuesday, February 2, 2016

Recap of 2015 San Francisco Residential Real Estate

The 2015 San Francisco real estate market continued its steady march upward reaching new historic high selling prices almost every month.  In one sense San Francisco is the “perfect storm” of residential real estate.  Inventory remains low, demand continues to be very strong, and government regulation tends to limit the supply of new housing.

Below are some of the highlights we’ve found analyzing our statistics and reporting during 2015:

1.  Single family homes comprise about 44% of our residential market;  condominiums (including TICs and co-ops) are 56% of the total.

2.  For the second year in a row the total number of sales has decreased by about 7%.  From 2008 to 2012 the number of sales had increased between 3 and 16%.

3.  The percentage of single family homes and condos that sold below $1,000,000 has reached a new low of 38%.  62% sold for over $1,000,000.

4.  Only 110 homes sold below $500,000, less than 10 per month.  Most of these were either fixers or part of a “below market rate” program where selling and re-sale prices are mandated/regulated by legislation.

5.  2 bedroom/2 bath condominium units were the most sought after home in San Francisco followed by 1 bedroom/1 bath condo units, and then 2 bedroom/1 bath single family homes.

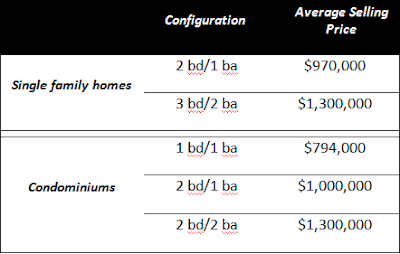
6.  Average selling prices for the year are summarized below:


     7.  Total market share by selling price range shows:


8.  The most active real estate districts in San Francisco for single family home sales in 2015 were:


 9.  
The most active real estate districts in San Francisco for condominium sales in 2015 were:


Here's a map from the MLS showing the general boundaries of the 10 real estate districts in San Francisco:


Thursday, April 17, 2014

Is San Francisco real estate a good investment ... ?

... even at today's prices?  One of our colleagues has a client who asked this question after their offer was not the winning bid.  (This was the third property property where they lost out to higher offers).

This graphic will let you know how it has worked out over the past few years:


If you expect to hold on to the property for five years our recent history suggests you should be able to ride out even the worst of downturns.

Wednesday, March 19, 2014

Annual Median Sales Price Continues to Zoom Up

Most of our reports and statistics focus on specific configurations of single family homes and condos.  For buyers and sellers that tends to provide a more realistic picture of the slide of the market their property or prospective property lies.

On the other hand it's useful to step back occasionally and look at the whole picture.  Here's what the annual median sales price for single family homes and condos/TICs/co-ops looks like since 2000:


(Click to enlarge)

The blue line shows the annual median sales price trend.  The median sales price in 2011 was 6% lower than the previous year.  In 2012 the median sales price was more than 12% above 2011 and that trend continued in 2013 when the median sales price increased almost 16% over the prior year.

So far this year (first two months) the median sales price has been almost 12% over 2013.  Prior to the economic downturn the highest annual median sales price was in 2007 which we have now far surpassed.

At the same time, inventory has struggled to keep pace.

(Keep in mind these numbers are derived from listings/sales reported in the San Francisco Association of Realtors MLS system so they do not include private sales and sales of many/most new construction condos).

Thursday, January 16, 2014

Annual Sales Volume

There was a misleading headline in one of the local real estate blogs recently suggesting that "Fewer San Francisco Homes Sold In 2013 Versus 2012".  But the annual numbers reported in that post actually referred the full bay area, not just San Francisco.  In San Francisco, despite tight inventory pretty much all year long, the number of residential sales in San Francisco was actually up by 2.7% in 2013 compared to 2012 (according to the MLS).

The post went on to say that December sales were down compared to the previous year (that also shows up in the MLS numbers) but it also said that the median sales price was down which is not supported by MLS numbers which show an increase of 11% compared to December 2012 median sales price ($849,444 compared to $765,500).


The actual differences of the number of properties sold are fairly trivial and it's important to note that the MLS numbers represent mostly resale properties and don't include most new construction sales.  Nevertheless, the implication of the post was that sales and prices are slowing down in San Francisco which is not what the local numbers actually show.


Friday, January 11, 2013

It's been a busy quarter

Since blogging isn't my primary occupation, I'll use that as the best excuse for the long time since our last update.  Since our last post we've had four closings -- a condo in Sausalito, two commercial condos in San Francisco, and a home in Pacifica.  And our experience is borne out by the broader sales statistics our monthly reports, the latest version of which will be available at boldsf.com in the next few days.  In the meantime, here are some highlights:

  • There has been a definite shift in pricing toward the high end of the market.  
    • The percentage of homes (condos and single family homes) selling for under $1million has fallen to 74% this year, down from almost 80% last year.  The last time this percentage was this low as back in 2008.
    • 6% of sales in 2012 were over $2million.  In 2011 that percentage was 5%.  The last time the high end of the market represented this much of the total market was, again, back in 2008.
  • The average sales price of a 2 bedroom, 2 bath condo in San Francisco breached the $1million barrier in December reaching $1,019,000.  This tops the three previous months where we've seen a steady climb in selling prices from $889,000 in September, to $893,000 in October, to $995,000 in November.  

  • And this does not appear to be a statistical anomaly -- the median sales price shows a similar steady increase. For the entire year 2012, 885 2 bedroom, 2 bath unit were sold. You have to go back to 2004 to see a greater volume of sales.

Wednesday, February 15, 2012

Sales Rates

Here's some interesting statistics that give some clues about the state of the San Francisco real estate market.
First, for the full year 2011, the number of residential sales increased again for the third year in a row. 


More properties (single family homes, condos, TICs and co-ops) were sold last year than any year since 2007.

Sales for January, 2012, also showed strength:


Although slightly fewer sold this January than January, 2011, overall the trend is positive since the low of downward trend that started after 2007.

Thursday, January 12, 2012

San Francisco Year-end Statistics

The number of sales of single family homes and condos/TICs in San Francisco continues an upward trend since hitting a low in 2009.  We're at about 89% of total sales compared to 2007 and 80% compared to 2006.  Selling prices are not showing an increase yet but, even in San Francisco, laws of supply and demand generally work.  (See following post).

As in most years, the number of sales was down slightly compared to November but, generally, monthly sales in 2011 followed the normal seasonal fluctuations.  (Sorry for the "busy" chart).