Showing posts with label active listings report. Show all posts

Sunday, January 15, 2023

December and 4th Quarter Recap

This week we posted our regular monthly and quarterly reports for 2022 as well as our biweekly New Listing Market Watch report.  Here are some highlights (lowlights?).

NewListing Market Watch

  • ·       Single family new listings: 94 in 2021, 64 in 2022, 42 this year.
  • ·       Condo new listings: 241, 151, and 84


Fundamentals

  • ·       Sales in December down compared to November (typical for this time of year)
  • ·       Average selling prices are down compared to November, -2% for single family homes and 22% for condos.  Compared to December a year ago average selling prices are down 22% for single family homes and 24% for condos.
  • ·       Inventory is up over 50% for single family homes compared to a year ago, and 7-8% for condos.


By PriceRange

  • ·       Premiums for the year compared to 2021 were steady at 112% for single family homes and 103% for condos. 

  • ·       BUT, for the last six months premiums dropped for single family homes to 105% and for condos to 100%.  (By comparison for the last half of 2021 premiums were 112% for single family homes and 105% for condos).


Quarterly

  • ·       For the five configurations of single family homes and condos we track, the number of sales and average sales prices were down across the board.

Monday, August 30, 2021

Signs of Typical Fall Inventory Uptick

 Heading into the Labor Day weekend we're seeing signs of the usual increase in inventory typical in early September. 

As you can see from this overly busy graphic, the number of active listings increases in September, October and early November every year regardless of recession or pandemic. (These numbers are calculated in the first week of each month.  When Labor day falls in the latter part of the first week of September the increase in listings doesn't show up until the early October figure).

The other indication is the increase in "Coming Soon" listings in the MLS.  In San Francisco the number of "coming soon" listings has increased from 170 to 196 in just seven days.  Most of the "coming soon" listings are condos -- 136 compared to 120 a week ago.  "Coming soon" single family home listings increased to 60 compared to 50 a week ago.


Monday, February 25, 2019

Number of Homes For Sale Up Compared To Last Year

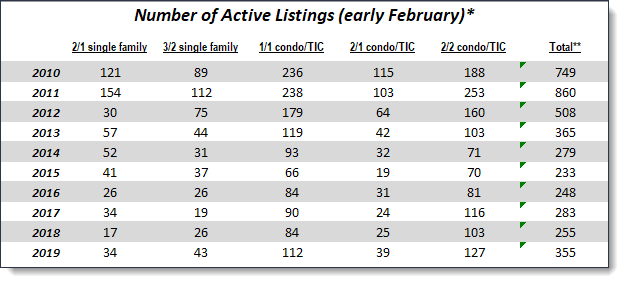
We track the number of active listings on the market in San Francisco once a month, usually on the 8th.  Early in February, the number of active listings was significantly higher than a year ago (355 vs 255).

We also track five configurations of single family homes and condos.  The increase in active listings was seen in each of those five configurations.


The number of active listings was at its highest since 2013.

* Survey is usually done within 7 or 8 days after the beginning of the month.
** These five configurations represent approximately 60% of residential real estate sales in San Francisco.


Tuesday, February 13, 2018

New Listing Report and Active Listings Report

New listings were slightly ahead of the same two week period last year -- 278 to 253. 


15% of those new listings went into contract within the same two week period which is about level with the last three reporting periods back to the first of the year.


Price reductions for the past two weeks were double those of the prior two week period but were only a scant 7 for single family homes and 14 condos.

We also track the total number of active listings for five configurations of single family homes and condos at the beginning of each month.  In three of those five categories total active listings at the beginning of February were down compared to last year at this time. 


Even though the weather may last week may have said "spring market", we are still facing very low inventory levels and continuing high demand.  Attendance at weekend open house showings is strong and multiple offers abound.