Showing posts with label new listing market watch. Show all posts

Tuesday, November 16, 2021

New Listing Market Watch and 3-county report

 Our bi-weekly New Listing report shows a further decline in new listings over the past two weeks compared to the previous two week period.  A decline in new listings is typical (and highly predictable) for this time of year and will continue until after New Years if this this year follows.

New single family home listings were 140 compared to 166 in the prior two week period.  Condos were 199 compared to 259 in the prior period.  Compared to a year ago new listings of single family homes was 140 in the last two weeks compared to 161 a year ago.  For condos the 199 new listings this year compares to 227 a year ago.


On our 3-County report the same drop in active listings can be seen.  In San Francisco the total number of active, in contract, and pending listings is down 90 compared to a week ago (1,801 compared to 1,891).  A similar decline can be seen in the numbers for Marin and Sonoma counties as well.


The full reports can be seen at our web site.


Monday, September 20, 2021

Big Uptick in New Listings

In a “normal” year the 14-day period following Labor Day brings one of the largest increases of new inventory coming onto the San Francisco residential real estate market.  This year was no exception with 281 single family homes and a whopping 536 condos/TICs having been added.


Compared to the previous 14-day reporting period there were 147 single family home and 187 condos/TICs added.  That’s a 91% increase in single family homes and 187% increase for condos/TICs. 

For a similar 14-day period in 2020 there were 250 single family homes and 459 condos/TICs that were added.  That is an 8% increase for single family homes and 17% increase for condos/TICs.

The influx of new inventory into our market will provide buyers with more opportunities with about 1.6 months of available inventory for single family homes and 3.6 months of inventory for condos/TICs.  And with such a large number of available listings it has also brought 30 price reductions in single family homes and 78 price reductions in condos/TICs.

If the pace of sales holds we are on track to have the largest number of closed sales since 2013.

The full report can be found on our web site.

Sunday, March 14, 2021

Spring Market (already)

 Our spring residential real estate market has started early and continues strong.  Single family homes added 174 listings in the last 14-day reporting period; 53% higher than the same 2-week period in 2020.  Compared to the previous 14-day period single family homes new listings went from 141 to 174, a 25% increase.

Condos/TICs saw an increase compared to the same 14-day period last year of 73% from 172 to 308.  Our prior 14-day period saw a very slight decrease from 311 to 308, a 3% decrease.

As of 3/10/2021 there was approximately 12 weeks of available inventory for condos/TICs and there are 109 in the “coming soon” category.

The average selling price for the five configurations we survey each month shows that 2 bedroom, 1 bath and 3 bedroom, 2 bath single family homes saw an increase in average selling price of 15% for the 2/1s and 3% for 3/2s compared to the previous month.

1/1 and 2/1 condos/TICs each saw an 8% increase in average sales price while 2/2 condos/TICs saw a 2% decrease compared to the prior month.

We also analyze residential sales by price range.  One revealing item shows up when comparing the number of single-family homes sold in 2019 vs 2020.  In the price range from $1 million to $2.5 million total sales for single family homes made up 68% of all sales in 2019 but jumped to 71% in 2020.

73% of condos/TIC sales were in the range from $800k to $1.5 million in 2020, virtually unchanged from 72% in 2019.  Another 14.5% showed up in the $500k-$799k range in both 2020 and 2019.

The full reports are available at our blog:  www.boldsf.com/Statistics

Or the individual reports:

Bi-weekly Market Watch

San Francisco Sales by Price Range


Monday, February 22, 2021

New Listing Market Watch - Spring has Sprung Early

Although we had some rain during the past two weeks, we are now in the midst of a weeklong sunny and warm spell.  


The San Francisco residential real estate market continues to add substantial numbers of new inventory.  In the last 14 day tracking period single family home inventory was increased by 74% over the same period in 2020.  81 homes vs 161.  Condos/TICs had a 93% increase going from 161 to 311.


In 2021 the first four 14-day reporting periods had single family homes increasing by 23%, 380 to 468 compared to the same four reporting periods in 2020. Condos/TICs had a 16% increase:  673 vs 783.

Additional information, during 2020 the average number of single family homes that sold each month was 205.  The number of condos/TICs was 241.

The number of price reductions of single family homes dropped compared to the prior period:  23 vs 11 which is essentially the same as the same period a year ago.  Price reductions of condos remained high but virtually unchanged compared to the prior week:  57 vs 60.  During the same period last year there were 23 price reductions.

The full report can be seen at our website:

www.boldsf.com/Statistics


Tuesday, February 9, 2021

New Listing Market Watch - early February

Has the spring market begun?  In the last two weeks there were 448 new residential listings in San Francisco compared to just 264 for the same period in 2020.  Just over 300 were condos/TICs -- double the number in 202.  There were 147 new listings of single family homes compared to 108 a year ago -- a 36% increase.

Compared to the prior 2-week period ending 1/25/2021 new listings of single family homes jumped from 98 to 147.  Condos fell slightly from 316 to 301 new listings.


There were 23 price reductions of single family homes and 57 price reductions of condos.  Both of those numbers are more than double compared to the same period last year (10 and 24 respectively). We haven't seen that many price reductions since just before the Thanksgiving holiday.


Tuesday, December 22, 2020

Last New Listing Market Watch before Christmas

Since July our residential real estate market has rebounded and indicates there is continued demand for San Francisco single family homes and condos. While demand remains relatively constant compared to last year, inventory is very different story.  Still too few single family homes and too many condos/TICs.  During the last 14-day Hot Sheet periods, the number of listings of single family homes is up 9% compared to the same period in 2019 while condos/TICs listings are up 142% compared to the same period in 2019.

Compared to the previous 14-day period single family homes are the same at 99.  Condos are up by 36% (123 to 167 units).  We still expect the 4th quarter will see the best quarter of 2020 in actual closings.

Average selling prices are falling for most configurations of homes that we survey with the notable exception of 3 bedroom, 2 bath single family homes which are averaging about 3% above 2019. 

It is also evident that, as usual, many units are being withdrawn presumably for at least 30 days and will reappear in the new year as “coming soon” or active with zero days on the market.

For the full report go to our website .


Tuesday, December 1, 2020

Post Thanksgiving; Pre Christmas

New listings coming onto the San Francisco residential real estate market in the last two weeks has reverted in some ways to "normal".  Normal in the sense that during the last 14 days the number of new single family home listings has declined by 39% compared to the prior two week period and condos/TICs declined by 46%.  Regardless of what the economy is doing every year we always see this kind of decline from Thanksgiving until after the new year.

But compared to the same period a year ago the number of new single family home listings coming on the market is up 130% and condos/TICs are up 131%.  So, not so normal.


Data also shows the number of sales for November (through 11/29) is up 10.4% compared to November last year.  (Single family homes are up 16% and condos/TICs are up 7%.


The number of price reductions in the last 14 days are the lowest since July, 2020.  There were 21 price reductions of single family homes and 79 reductions of condos/TICs.


The full reports can be found at our website.

Tuesday, September 22, 2020

New Listing Market Watch -- record numbers of new listings (and price reductions)

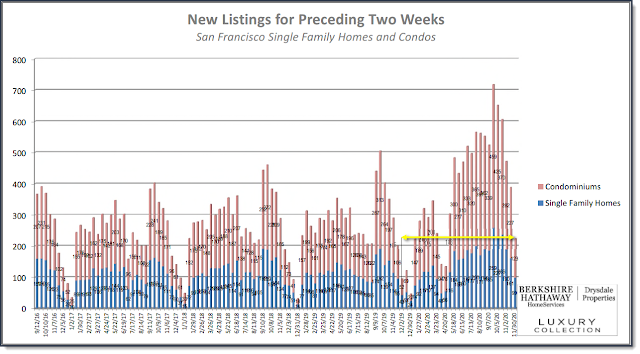
Just when you might have thought things might settle down now that we're well past the Labor Day holiday, the number of new listings in the past two weeks has increased to levels we haven't seen in at least seven years.  Total new listings in the last two weeks were 718 of which 259 were single family homes and 459 were condos.  

That total of new listings is 142% of the same period last year and 137% compared to the prior two week period.  

Price reductions have also jumped -- 53 for single family homes and 173 for condos.  

Those numbers are 171% of the number of price reductions for single family homes a year ago and 339% for condos.

You might conclude from these numbers that sales have taken a nose dive.  But one of our other reports shows that the number of closed sales so far for September have exceeded the number that closed for entire month of September last year (140 compared to 127).  Closed sales of condos so far this month are 187 compared to 191 for the entire month last year.  So it appears that the sales rate hasn't changed significantly compared to a year ago -- it's just inventory that has climbed so dramatically.

The full reports can be found at out web site:

www.boldsf.com/Statistics


Wednesday, September 9, 2020

New Listing Market Watch - the end of summer market

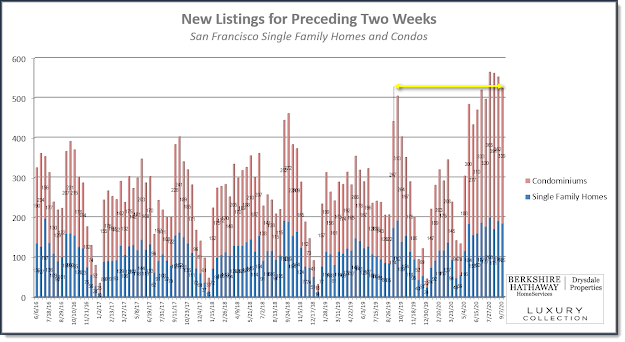
 The number of new listings in the last two weeks eased off from recent highs in the prior six weeks although still above 500 at 524 compared to the prior two week period (553).  Compared to the same period last year (441) new listings were almost 20% higher.


The bulk of new listings continue to be in the condo market.  During the prior two weeks 339 new listings were added compared to 362 in the prior period and compared to 267 a year ago.  There were 185 new listings of single family homes compared to 191 in the prior period and compared to 174 a year ago.

In comparison, 28 single family homes went into contract and 97 changed status to "pending".  Similarly, 59 condos went into contract and 103 went into pending status. 

Similarly, the number of price reductions fell below the records set during the last six weeks.  


And again condos led the way with 149 price reductions compared to 167 in the prior period and compared to 22 a year ago.  Single family homes posted 34 price reductions compared to 48 in the prior period and compared to just 9 a year ago.

Since virtually all of this took place prior to Labor Day we'll be watching closely to see what happens in the next two weeks which, in a normal year, there would be a jump in new listings following the holiday.


Monday, August 24, 2020

New Listing Market Watch - new normal?

 New residential listings (553) continue to vastly outpace new listings in the same two-week time period a year ago (207). It continues the trend we've seen over the past five two-week periods.

65% of new listings were condos. Compared to the previous period new condo listings were down slightly (362 vs 391).  New condo listings were three times what there were in the same period a year ago (363 vs 122).  

New listings of single family homes were up compared to the prior period (191 vs 171) and more than double compared to the same period a year ago (191 vs 85).

Historically, August would see a drop off of new listings with sellers and listing agents holding off until after Labor Day.  

The number of single family home listings that went into contract in the last two weeks as a percentage of new listings is down to 14.7%.  That's the lowest it's been in 14 weeks but it's well above the same period a year ago (14.7% vs 11.8%).

For condos the percentage is even lower at 9.4%.  That's up slightly compared to the prior period (9.4% vs 7.9%) but only half of what it was a year ago (9.4% vs 20.5%).

Price reductions remain at historic highs led almost entirely by condos.  There were 48 single family homes posting price reductions in the last two weeks compared to 40 in the prior period and compared to only 8 during the same period a year ago.  Condos posted 167 price reductions compared to 170 in the prior period and only 19 a year ago.


Overall the number of single family homes that closed escrow in the last two weeks is up  approximately 12% compared to a year ago (87 vs 78).  For condos the number of closings is off by 12% (85 vs 97).


Monday, August 10, 2020

New Listing Market Watch - WOW2

More listings, more price reductions.  The number of new listings in the last two weeks almost reached the record level of the prior two week period with 562 new listings (171 single family homes and 391 condos).  391 condo listings is the highest we've seen in a two week period since we've been keeping these records, eclipsing the previous record just set in the prior period of 365.

Compared to the same period a year ago total new residential listings are up 273% (562 vs 206).  There were 171 new listings of single family homes compared to 86 a year ago and 391 condos compared to 120 a year ago.

The number of price reductions has also increased compared to the prior two week period.  In the last two weeks there were 40 price reductions on single family homes vs. just 5 in the prior period.  There were 170 condo price reductions compared to 151 in the prior period.  Compared to a year ago there were just 9 single family home price reductions and just 17 for condos.


In summary, we have had five two-week period with over 300 new listings of condos and over 100 condo price reductions in the last four two-week periods. 

See the full report at our web site.


Tuesday, July 28, 2020

New Listing Market Watch -- WOW

To sum up, everything is double what it was a year ago except single family homes price reductions.

There were 565 new residential listings in the last two weeks compared to 238 in the same period a year ago. Of those 565, 200 were single family homes and 365 were condos -- each more than double compared to a year ago.  This is the highest number of new listings for a two week period since at least 2014 when we first started tracking.

Even compared to the prior period new listings of single family homes rose from 177 to 200 and condos rose from 320 to 365. 


Condo price reductions was the other big number -- 151 compared to 25 a year ago and compared to 107 during the prior two week period.  Price reductions for single family homes were down:  only 5 in the last two weeks compared to 20 a year ago and compared to 39 in the prior two week period.


23% of new single family home listings went into contract compared to 18% in the prior period and compared to 18% a year ago.  Only 9% of condo new listings went into contract compared to 17% in the prior period and compared to 15% a year ago.


The full report can be found at our website.

Monday, July 13, 2020

New Listing Market Watch - new listings continue to soar

This is the second two-week period where new listings topped 200% or more compared to the same period a year ago.


There were 497 new listings in the last two weeks (177 single family homes and 320 condos) compared to 241 new listings (103 single family homes and 138 condos) in the same period a year ago.

For comparison, during the last two weeks only 122 properties closed escrow (56 single family homes and 66 condos) -- only 24% of the number of new listings.

This was also the fourth two-week period in a row where price reductions were double what they were in the same periods a year ago.


The full report is on our web site along with other reports we publish.

Tuesday, July 7, 2020

Tale of Two Markets

The San Francisco residential real estate market continues with an ever increasing number of new listings.  John and I have been tracking these "hot sheet" data every two weeks for at least the last seven years and the last 14 day period, June 15 thru June 29, has the highest number of new listings that we've seen.  Year over year during the same 14 day period total inventory was 236 last year and 520 this year, a 220% increase.  Compared to the prior two week period there was an 11% increase.

The San Francisco market has become a rather unique community as 70% of residential properties are condos/TICs and only 30% are single family homes.  With limited available land the percentage of condos/TICs will continue to grow with single family homes becoming an even scarcer commodity.

While the total number of new listings have been record breaking the distribution between single family homes and condos/TICs is well worth noting.  64% of the listings were condos/TICs with single family homes accounting for the other 36%.

The single family home market showed an increase of available inventory to about 10 weeks but 2 bedroom/1 bath and 3 bedroom/2 bath categories went up to only 4 and 7 weeks respectively.  June closings so far show that 26 2/1 single family homes closed with an average selling price of $1.26 million, 21 days on market, and premium (selling price/listing price) of 110%.  There were also 30 3/2 single family homes that closed at an average selling price of $1.6 million, 18 days on market, and premium of 106% (selling price/listing price).

We should also quickly note the numbers of luxury homes has also increased and available inventory has risen to about 3 months for homes priced between $2.5 - $5 million and 6 months for homes priced over $5 million.

The condo market place is entirely different.  During the same 14 day period a year ago there were 128 new listings compared to 333 this year -- a 260% increase.  The biweekly to biweekly comparison is only 7% increase.

Typical for San Francisco you would find available inventory running from 4-6 weeks.  With the huge numbers of properties coming on the market in just the last three 2-week reporting periods new inventory has totalled 913 units.  Available inventory for homes priced below $1.5 million is 8-10 weeks; $1.5-$2.5 is 12 weeks; $2.5-$4.5 is 20 weeks; properties above $4.5 million jumps to 40 weeks.

Sold condos in June results are as follows.  For the two largest categories of condominiums (1/1 and 2/2) there were 29 closed 1/1 units with an average selling price of $893k with days on market of 35 and a premium of 100%.  For 2/2 units, 39 closed with an average selling price of $1.6 million, 37 days on market and a premium of 99%.

While buyers will find a broader array of residential properties available single family homes remain in demand and it appears that premiums will be between 2-8% rathether than the 10-20% we've seen previously.  The condo market is under pressure from the sheer number of listings and we expect to see some leveling or lowering of prices given the history number of price reductions we've seen over the past 8 weeks.

Tuesday, June 30, 2020

New Listing Market Watch - record number of new listings (condos) and price reductions (condos)

The headline is the story.  In the last two weeks there were 333 new listings of condos, a record for the seven years we've been keeping track.  (As a reminder, these are almost entirely resale properties as reported on the MLS.  New construction condos being sold by the developer are not included except for a handful that some developers put on the MLS essentially as advertising.  Also not included would be any off-market sales.)

In each of the last four 2-week periods (covering two months) we have had 300 or more new condo listings except for one period when there were "only" 277. 

The latest two week period of 333 compares to 310 the prior period and compares to 128 a year ago.

We had 187 new listings of single family homes compared to 160 the prior period and compared to 108 a year ago. 


So it won't come as much of a surprise that we also had 101 price reductions on condos during the past two weeks compared to 84 in the prior period and compared to 84 and 64 in the prior two periods.  A year ago we had 32.

There was also an increase in the number of price reductions of single family homes:  43 compared to 33 in the prior period and compared to 20 a year ago.


The number of properties that went into contract in the last two weeks held steady for both single family homes and condos.  29 single family homes went into contract compared to 32 in the prior period and compared to 20 a year ago.  36 condos compared to 36 in the prior period and compared to 32 a year ago. 

Expressed as a percentage, here's a graph showing number of properties going into contract as a percentage of the number of new listings.


And finally, just to drive the point home, here is a graph showing new listings in two week increments over the past five years.  It's a little busy but it's easy to see how out of the normal range condo listings have been recently.


Monday, June 15, 2020

New Listing market watch-- condos surge, price reductions increase

The number of new listings to come on the market in the last two weeks continues to increase compared to prior periods and compared to the same time period last year.


Here's another look comparing new listings this year compared to prior years.  It's apparent that the number of new listings of condos is (and has been for the past few weeks) substantially higher than any of the past 5 years.  New listings of single family homes has been mostly in the same range as prior years.


For the past six weeks (three two-week periods) new listings have significantly surpassed the same periods a year ago.  The majority of these new listings have been in the condo market.

There were 160 new listings of single family homes in the last two weeks compared to 156 in the prior period and compared to 127 during the same period a year ago.  There were 310 new listings of condos compared to 277 in the  prior period and compared to 196 a year ago.

Overall, total new listings (single family and condos) were up 46% compared to a year ago.

At the same time, price reductions are up.


The number of new listings in contract has remained steady.  During the past two weeks 32 single family homes went into contract compared to 31 in the prior period and compared to 21 a year ago.  For condos, 36 went into contract compared to 32 in the prior period and compared to 34 a year ago.


Tuesday, June 2, 2020

New Listing Market Watch - new listings ease, price reductions surge

New listings of single family homes during the past two weeks were down compared to the prior two week period (156 vs 184) but up compared to a year ago 156 vs 123). 

A similar story with new listings of condos which were down compared to the prior period (277 vs 300) but up substantially compared to a year ago (277 vs 167).


Almost 20% of new single family home listings went into contract during the past two weeks compared to 13% during the prior period and compared to 15% a year ago.  For condos, 12% went into contract compared to 8% during the prior period and compared to 19% a year ago.


There was a jump in price reductions during the past two weeks.  30 single family homes posted price reductions compared to 22 during the prior period and compared to only 6 a year ago.  Condos posted 64 price reductions compared to 35 in the prior period and compared to just 6 a year ago.


Tuesday, May 19, 2020

New Listing Watch - lots more listings

New listings of single family homes during the last two weeks were 30% higher compared to the same period a year ago (184 vs 141).  New listings for condos were at 69% higher than a year ago (300 vs 178).  Compared to the prior two week period new listings for single family homes were up 59% (184 vs 116); new listings for condos were up 60% (300 vs 188).


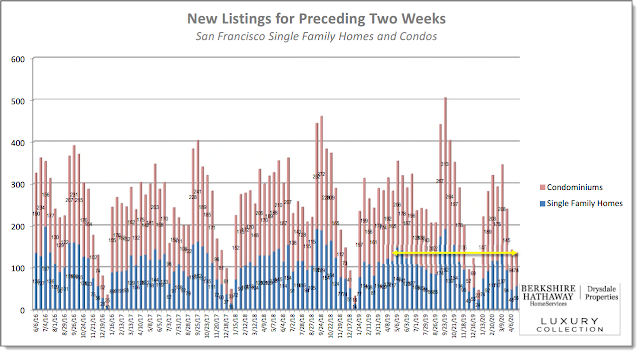
As is apparent from the graph above, the last two weeks saw the largest number of new listings compared to any two week period in the last six years except for the two week period ending 9/23/2019.

The number of listings that went into contract when down to 13% for single family homes and 8.3% for condos -- not surprising given the number of new listings.


The number of price reductions has doubled compared to the prior period for single family homes (22 vs 11) and almost doubled compared to the same period last year (22 vs 12).  Condo price reductions increased by 67% compared to the prior period (35 vs 21) and by 40% compared to the same period last year (35 vs 25).


Now the question is "will buyers return in the same proportion"?

Stay tuned.

[Edited to correct percentages in the first paragraph. 5/21/20]

Tuesday, May 5, 2020

New Listing Watch -- back to the old normal?

What a difference two weeks makes, especially when it contains a "modified" shelter-in-place order that loosens previous restrictions on real estate transactions.

Two weeks ago we were reporting new listings down by more than 50% compared to the same period a year ago.  Today's report shows new listings back up to 86% of a year ago (304 vs 384) and more than twice what they were compared to two weeks ago (304 vs 164).


The number of price reductions increased as well:  11 single family homes had their asking price reduced compared to 7 two weeks ago and compared to 7 a year ago;  there were 21 condo price reductions compared to 7 two weeks ago and compared to only 4 a year ago.


We'll have to wait to see if sales keep pace with the increase in listings.  But it's encouraging to see that the number of new listings going into contract held at 26 single family homes compared to 15 two weeks ago and compared to 27 a year ago.  Similarly, 31 condos went into contract compared to just 9 two weeks ago and compared to 41 a year ago.


A full copy of the report can be found at our web site:
www.boldsf.com/Statistics


Monday, April 20, 2020

New Listing Market Watch - yes, the new normal

New listings during the past two weeks are down slightly from the prior two weeks and are less than half compared to a year ago:  134 vs 142 two weeks ago vs  282 a year ago.

This reduction shows most heavily in the condo market where condo listings are only one-third of a year ago (78 vs 165).  Condo listings were down almost 20% compared to the prior two week period (78 vs 94).

Single family homes fared somewhat better.  Compared to a year ago new listings were down just 12% (56 vs 117) and up slightly compared to the prior period (56 vs 48).


Price reductions were down during the past two weeks compared to the prior period (14 vs 22) and compared to the same as a year ago (14 vs 28).  Most of the drop in price reductions happened in the condo sector (7 vs 20 a year ago) and 7 vs 17 compared to the prior period.


It's worth noting that 73 listings came back on the market (BOM): 22 single family homes and 51 condos.  These are a combination of properties which had been placed in a "hold" status on the MLS (temporarily taken off the market) and properties that had been in contract but had failed to close so the property went back to an "active" status in the MLS.

For single family homes more than half (12 of 22) of the BOM listings were previously in contract which were cancelled.  For condos 25% of BOM listings were properties that had been in contract.  75% were listings which had been active but during the past two weeks had been put into "hold" status.

Finally, the number of properties that closed escrow since the first of April through April 19 was 118 (52 single family homes and 66 condos) which is 34% of closings during the same period last year which totaled 345 (140 single family homes and 205 condos).