PropertyRadar, which specialized in distressed* home sales during the recession has issued their statewide monthly statistics that show a similar decline in sales to what we recently reported for San Francisco.
Their numbers show a year-over-year decline of 3.1% comparing November 2015 to November 2014.
They also show November sales declining in roughly the same way for the past four years as our numbers showed for the 11 months of each year for the past three years.
Their primary explanation seems to be the new TRID disclosure rules** that went into effect in October that many real estate agents and mortgage brokers and lenders are still trying to get used to. While that might explain a small decline this year compared to last, it certainly doesn't explain the previous three or four year declines.
*Distressed properties are those where the owner owes more in loans and taxes than the current property value and, therefore, may require a short sale or similar transaction.
**Follow the link above if you really want to get down in the weeds with detail. For a somewhat easier to understand explanation try this Fidelity National Title site. Suffice to say the new rules mandate certain waiting periods that can lengthen the escrow period prior to closing. Anecdotal reports we're hearing from our mortgage partners, do not suggest any across-the-board delays.
Friday, December 18, 2015
Wednesday, December 16, 2015
Number of Sales is Down for the First 11 Months
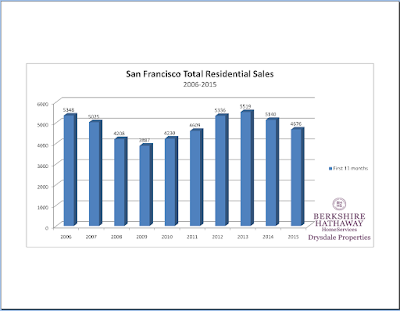
The number of residential sales (single family homes, condos/TICs) for the first 11 months of 2015 is the lowest in four years:
And, this is the second year of declining number of sales. This year's sales through November were 4,676 compared to 5,140 in 2014 and 5,519 in 2013. 2014 was down 7% compared to 2013. This year we're down 10% compared to 2014.
It's not clear what's causing the slowdown. Possibly the large number of new construction condos that have come on line in the past three years is one factor. (Our numbers are based on San Francisco MLS reported sales which, for the most part, do not include new construction sales).
Although the number of sales varies in a predictable pattern every year (recession or boom time), there was a notable decline this year in September with only 344 sales recorded in the MLS -- 100 fewer than the previous year. That's the lowest number of sales in the 10 years of data we have in the MLS.
(Apologies for the very busy graph but it readily shows September sales this year as being the lowest. It also shows the standard sales pattern in San Francisco of two peaks (Twin Peaks?) in sales every year centered around the spring market in May and June and then a second peak in October.
Monday, December 7, 2015
New Listing Watch - Seasonal Variations Dominate
Our New Listing Watch survey done today and looking back at the last two weeks shows the number of new listing and the number of new listings going into contract during that period to be almost exactly the same as a year ago. This demonstrates the seemingly inexorable seasonal variations.we see every year at this time: the number of listings will continue to go down until after New Year's when they will quickly increase and reach their spring peak in June.
Subscribe to:
Posts (Atom)


