Thursday, April 7, 2022

Month-to-month Fundamentals

Each month we prepare a one-page "fundamentals" report, one each for San Francisco, Marin and Sonoma.  Here are some highlights for Marin and San Francisco:

Marin Fundamentals – March sales were up substantially compared to last month 163 to 100 (single family homes) and 54 to 46 (condos).

Average selling prices were up $2,002 compared to $1,952 for single family homes but, as you can see, that increase was not uniform across all configurations.  Same with condos:  with average selling price $897 vs $859 a month ago.

Inventory has increased 126 compared to 96 at the beginning of February (single family homes) and 63 compared to 57 (condos).


San Francisco Fundamentals – the number of sales and average selling prices were up with a one exception.  Sales increased slightly for single family homes 239 vs 236 a month ago.  For condos sales increased substantially 367 vs 236 (55%).  Average sales prices have increased for single family homes ($2467 vs $2335 – 6%) and condos ($1,417 vs $1,377 – 3%).  The average premium (selling price / asking price) for single family homes is            117% for single family homes) and 106% for condos (about the same as last month).

Annual average sales prices are at record highs for the two categories of single family homes we track.  The largest condo configuration we track (2/2) is also back at all time highs with 2/1 condos on $35k off its all time high (2019).  Smaller condos like the 1/1 configuration are recovering more slowly.

Days-on-market have decreased across the board.

Inventory of single family homes is flat (203 vs 204) but condo inventory has jumped 10% to 734 vs 662 a month ago.


Wednesday, April 6, 2022

First Quarter 2022

We just completed our monthly reports and first quarter 2022 reports and have several observations.

[Reports page link]

SAN FRANCISCO

In San Francisco, 2021 recorded the highest number of residential sales since 2004 including single family homes and condos/TICs.  However, for the first quarter this year compared to 2021 first quarter there has been a decline of 17% in closed sales.  Single family homes fell about 12% and condos/TICs fell about 21% in the same first quarter comparison.

[San Francisco quarterly link]

At the same time the average selling prices for single family homes increased by 7% while condos/TICs were down by almost 2%.

Is scarcity driving up prices?  For single family homes this obviously has been true.  As of April 4 there was only 3 weeks of available inventory (number of available properties divided by the average number of monthly sales).  On the other hand, condos/TICs were a surprise as inventory has been hovering between 2 and 3 months.


Both 2 bedroom/1 bath and 3 bedroom/2 bath single family homes continue to establish new historic high average selling prices almost every month.  And 2/2 condos have returned to historic high prices after a downturn during the two years following the start of the pandemic.

And 1/1 and 2/1 condos have also seen recent upticks in recent selling prices but are still 3% off their previous high reached in 2019.


MARIN

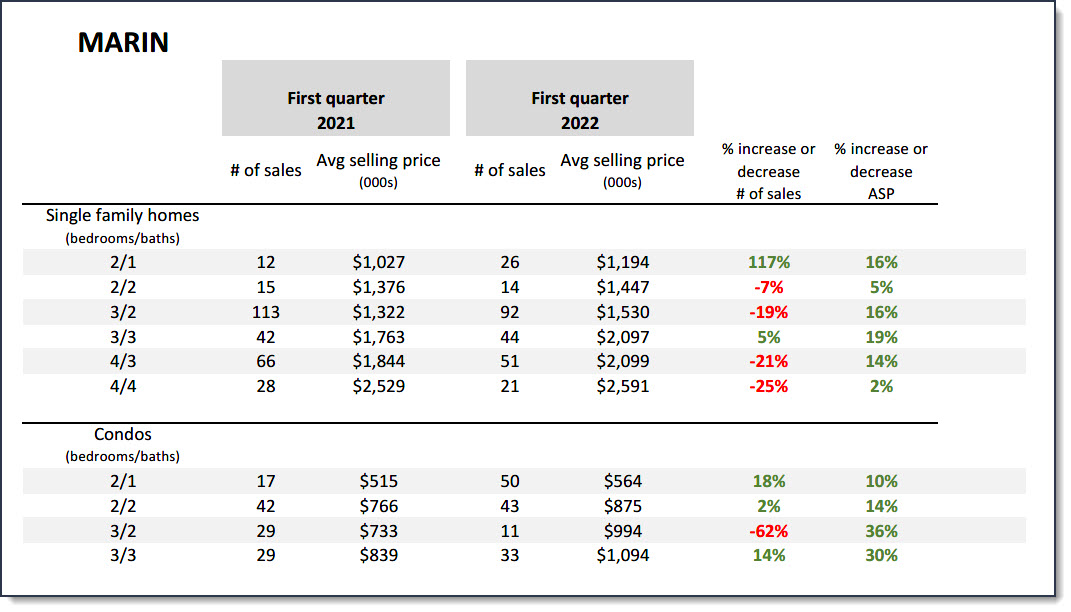
Total residential sales (including single family homes and condos) for the first quarter of this year compared to 2021 first quarter show a drop of 18% for all sales with single family homes falling 17% and condos falling 19%.  At the same time average selling prices for Marin County residential sales were up 6% with single family homes up 3% and condos up 16%.

[Marin quarterly link]

As of 4/4/22 Marin has almost three weeks of available inventory of single family homes and four weeks of available inventory of condos. 


Thursday, March 10, 2022

Monthly Review and Clues to the Remainder of the Year


Some notes from our recent monthly reports and our weekly 3-county report


·         3-county report

o   There are fewer active listings of single family homes in both Marin and San Francisco than there are homes that are “pending” (already in contract).  Same situation last month.  While this happens sporadically, it's unusual for it to happen two months in a row and seems be a symptom of low inventory and climbing interest rates.


o   Inventory is trending up slightly compared to a week ago for single family homes in all three counties with condos down slightly in both Marin and San Francisco

o   But compared to a year ago numbers are down across the board.  San Francisco down approx. 15%; Marin down 40% in single family homes and down 35% in condos. 


·         Fundamentals:

o   San Francisco number of sales of single family homes is down compared to January (22 vs 28) but overall number of sales was higher in February than January, as expected.

o   San Francisco average selling prices are generally up compared to the previous month, with 3/2 homes essentially flat. However, compared to a year ago average selling prices for single family homes are down 19% and average selling prices for condos is up slightly 2%.

o   San Francisco DOM is down substantially across the board and premiums are up

o   Marin number of sales of single family homes is up, as expected.

o   Marin average selling prices are down slightly overall for both single family homes and condos with the notable exception of 3/2, 3/3 and 4/4 configurations.  Compared to a year ago average selling prices for single family homes are down by 6% but condos are up by almost 10%.

o   Marin DOM is down significantly overall and premiums are up.

·         So, overall, month-to-month inventory numbers are following typical trends for this time of year but, again, compared to a year ago volume is down.


Monday, March 7, 2022

Market Summary

The San Francisco residential real estate market remains strong.  Following up on 2021 where total residential sales were the best since 2004.  7304 (2021) vs 7403 (2004). 

After a rather soft January, February saw a resumption in sales of single family homes with very low available inventory, strong demand, usually multiple offers, and average DOM of 14 days and premium (selling price divided by list price) of 126%.  Average selling price for 2/1 and 3/2 single family homes in February were $1.395 million and $1.8 million respectively.

Here's a graph showing the number of San Francisco residential sales in the last four years broken down into the first two months of the year and the last 10 months.


What is somewhat unexpected was the condo/TIC segment of our market where inventory came back very strong with almost 2 months of supply.  Demand has also increased as have month-to-month increases in selling prices as seen in the three configurations we survey (1 bedroom/1 bath; 2 bedroom/1 bath; 2 bedroom/2 bath).  

Of special note are 2/2 condos which are setting historic highs for average selling prices.  1/1 condos also saw an increase in February to $828k surpassing last year’s average selling price of $823k but lagging behind $871k set in 2019.

Other items of note:  

The number of pending* sales of single family homes is more than the the number of currently active inventory (222 vs 207).

There are 280 condos/TICs pending vs 659 active.

Comparing the last 14 days reporting period to the same time last year, both single family homes and condos/TICs show a 10% increase in new listings.

March closed sales for 2021 at 257 single family homes and 440 condos/TICs for a total of 697.  Closed sales for this March will be predictive for the remainder of 2022.

Tuesday, November 16, 2021

New Listing Market Watch and 3-county report

 Our bi-weekly New Listing report shows a further decline in new listings over the past two weeks compared to the previous two week period.  A decline in new listings is typical (and highly predictable) for this time of year and will continue until after New Years if this this year follows.

New single family home listings were 140 compared to 166 in the prior two week period.  Condos were 199 compared to 259 in the prior period.  Compared to a year ago new listings of single family homes was 140 in the last two weeks compared to 161 a year ago.  For condos the 199 new listings this year compares to 227 a year ago.


On our 3-County report the same drop in active listings can be seen.  In San Francisco the total number of active, in contract, and pending listings is down 90 compared to a week ago (1,801 compared to 1,891).  A similar decline can be seen in the numbers for Marin and Sonoma counties as well.


The full reports can be seen at our web site.