Tuesday, May 19, 2020

New Listing Watch - lots more listings

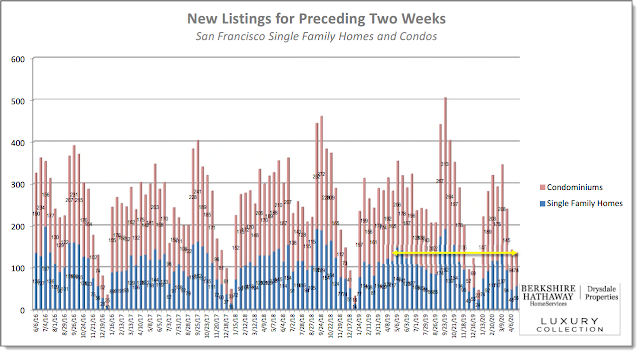
New listings of single family homes during the last two weeks were 30% higher compared to the same period a year ago (184 vs 141).  New listings for condos were at 69% higher than a year ago (300 vs 178).  Compared to the prior two week period new listings for single family homes were up 59% (184 vs 116); new listings for condos were up 60% (300 vs 188).


As is apparent from the graph above, the last two weeks saw the largest number of new listings compared to any two week period in the last six years except for the two week period ending 9/23/2019.

The number of listings that went into contract when down to 13% for single family homes and 8.3% for condos -- not surprising given the number of new listings.


The number of price reductions has doubled compared to the prior period for single family homes (22 vs 11) and almost doubled compared to the same period last year (22 vs 12).  Condo price reductions increased by 67% compared to the prior period (35 vs 21) and by 40% compared to the same period last year (35 vs 25).


Now the question is "will buyers return in the same proportion"?

Stay tuned.

[Edited to correct percentages in the first paragraph. 5/21/20]

Tuesday, May 5, 2020

New Listing Watch -- back to the old normal?

What a difference two weeks makes, especially when it contains a "modified" shelter-in-place order that loosens previous restrictions on real estate transactions.

Two weeks ago we were reporting new listings down by more than 50% compared to the same period a year ago.  Today's report shows new listings back up to 86% of a year ago (304 vs 384) and more than twice what they were compared to two weeks ago (304 vs 164).


The number of price reductions increased as well:  11 single family homes had their asking price reduced compared to 7 two weeks ago and compared to 7 a year ago;  there were 21 condo price reductions compared to 7 two weeks ago and compared to only 4 a year ago.


We'll have to wait to see if sales keep pace with the increase in listings.  But it's encouraging to see that the number of new listings going into contract held at 26 single family homes compared to 15 two weeks ago and compared to 27 a year ago.  Similarly, 31 condos went into contract compared to just 9 two weeks ago and compared to 41 a year ago.


A full copy of the report can be found at our web site:
www.boldsf.com/Statistics


Thursday, April 23, 2020

Are renters having trouble with their rent payments?

Interesting statistics published by the National Multifamily Housing Council to gauge what effect the Covid-19 shelter-in-place orders are having on rent payments:


Based on figures gathered nationally by the National Multifamily Housing Council covering in its survey of 11.5 million professionally managed apartment units.

So far only a 4% change from last month and last year.

May may be different.

Monday, April 20, 2020

New Listing Market Watch - yes, the new normal

New listings during the past two weeks are down slightly from the prior two weeks and are less than half compared to a year ago:  134 vs 142 two weeks ago vs  282 a year ago.

This reduction shows most heavily in the condo market where condo listings are only one-third of a year ago (78 vs 165).  Condo listings were down almost 20% compared to the prior two week period (78 vs 94).

Single family homes fared somewhat better.  Compared to a year ago new listings were down just 12% (56 vs 117) and up slightly compared to the prior period (56 vs 48).


Price reductions were down during the past two weeks compared to the prior period (14 vs 22) and compared to the same as a year ago (14 vs 28).  Most of the drop in price reductions happened in the condo sector (7 vs 20 a year ago) and 7 vs 17 compared to the prior period.


It's worth noting that 73 listings came back on the market (BOM): 22 single family homes and 51 condos.  These are a combination of properties which had been placed in a "hold" status on the MLS (temporarily taken off the market) and properties that had been in contract but had failed to close so the property went back to an "active" status in the MLS.

For single family homes more than half (12 of 22) of the BOM listings were previously in contract which were cancelled.  For condos 25% of BOM listings were properties that had been in contract.  75% were listings which had been active but during the past two weeks had been put into "hold" status.

Finally, the number of properties that closed escrow since the first of April through April 19 was 118 (52 single family homes and 66 condos) which is 34% of closings during the same period last year which totaled 345 (140 single family homes and 205 condos).

Thursday, April 9, 2020

New Listing Market Watch - the new normal?

In the last two weeks, as expected, new listings were down significantly compared to the prior two week period (142 vs 239) and compared to a year ago (142 vs 314). This affected both condos (94 vs 145 compared to the prior period) and single family homes (48 vs 94).


The total number of active listings at the beginning of April is the lowest it has been since we have kept records.


This graph above is a little difficult to read so let me describe.  The prominent green bars show the total number of active listings at the early part of April for each of the ten years back to 2010.  The faded bars are for each of the other months.

Maybe a little more surprising, the number of price reductions was down compared to the prior period and compared to a year ago.  For single family homes, there were 5 price reductions this period vs 11 in the prior two week period and vs 11 a year ago.  For condos the numbers are 17 this period, 31 in the prior period, and 27 a year ago.