Thursday, October 8, 2020

Highlights from Monthly and 3rd Quarter Reports

We've just posted our regular collection of monthly reports along with third quarter reports for residential listings and sales in San Francisco, Marin and Sonoma counties.  Also included are our Biweekly New Listing Report for San Francisco and weekly Tri-County report. The full reports can be found at our website:  www.boldsf.com/Statistics

Here are some highlights:

San Francisco

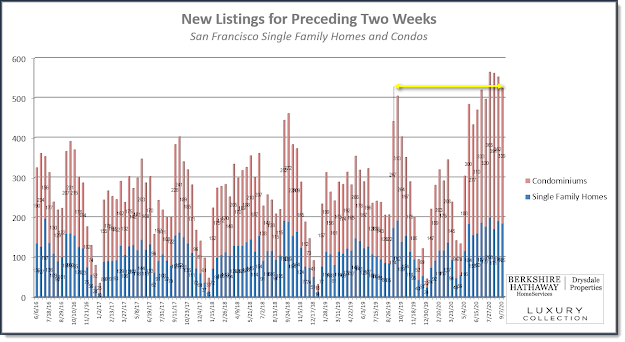
  • Every two weeks for the past four months San Francisco has added more than 500 new listings of single family homes, condos and TICs.  For the two weeks ending October 5 we added 652 new listings.  That compares to 403 during the same period last year.  The bulk of new listings are condos with 425 added in the last two weeks compared to 264 a year ago.
  • Every two week period for the past sixteen weeks we've seen 100+ price reductions posted for condos.  During the two weeks ending October 5 there were 208 price reductions compared to just 73 a year ago.
  • As of October 5 there were 1,401 condos listed for sale.  For September there were 308 condo sales that closed compared to 191 in September of 2019.

  • The conclusion seems to be there are more than the normal number of buyers for condos but they are substantially outnumbered by more and more listings coming on the market.
Marin

  • Inventory remains a problem in Marin county.  In September 240 single family homes closed escrow.  As of October 6 there were only 336 single family homes on the market -- barely a month's supply.
  • For the third quarter this year smaller single family homes (3 bedrooms or less) are selling for premiums above those for the same quarter last year. Premiums for 4 bedroom homes are slightly below last year's level.
  • The number of sales was up in the third quarter of the six configurations of single family homes we track compared to the same quarter a year ago.

Sonoma

  • Inventory is also a problem in Sonoma where 517 single family homes closed escrow in September and, as of October 5, there were 643 on the market.
  • For the six configurations of single family homes we track, all posted sales for the third quarter above those of the third quarter last year with the exception of 4 bedroom, 3 bath homes.
  • Premiums were also up in all of the configurations except the two largest.

Tri County
  • The number of sales of condos and single family homes in all three counties was up in September compared to a year ago with the exception of condos in Sonoma County.

Friday, October 2, 2020

Global Real Estate Bubble Index

The large, global investment bank UBS has put out it's annual Global Real Estate Bubble Index for 2020.  It lists 25 cities around the world and classifies them as Bubble Risk or Overvalued, Fair Valued, or Undervalued.  Of the 25 cities there are five in the US -- Los Angeles, San Francisco, New York, Boston and Chicago.

San Francisco is in the Overvalued group but trending down over the past three years:

Barrons describes the index this way when discussing the seven cities most at risk of a housing investment bubble:  "Faced with high price-to-rent ratios and uncertain rental price growth, investors searching for a buy-to-let home may want to look elsewhere."

Keep in mind this index is focused exclusively on residential real estate as investment.  So if you're not planning on renting your property the index probably isn't especially relevant -- but it is interesting.

Tuesday, September 22, 2020

New Listing Market Watch -- record numbers of new listings (and price reductions)

Just when you might have thought things might settle down now that we're well past the Labor Day holiday, the number of new listings in the past two weeks has increased to levels we haven't seen in at least seven years.  Total new listings in the last two weeks were 718 of which 259 were single family homes and 459 were condos.  

That total of new listings is 142% of the same period last year and 137% compared to the prior two week period.  

Price reductions have also jumped -- 53 for single family homes and 173 for condos.  

Those numbers are 171% of the number of price reductions for single family homes a year ago and 339% for condos.

You might conclude from these numbers that sales have taken a nose dive.  But one of our other reports shows that the number of closed sales so far for September have exceeded the number that closed for entire month of September last year (140 compared to 127).  Closed sales of condos so far this month are 187 compared to 191 for the entire month last year.  So it appears that the sales rate hasn't changed significantly compared to a year ago -- it's just inventory that has climbed so dramatically.

The full reports can be found at out web site:

www.boldsf.com/Statistics


Thursday, September 10, 2020

August Number of Sales and Average Sales Prices

The August 2020 residential real estate market in San Francisco showed some remarkable resilience despite Covid-19.  The number of single family homes closed sales showed a 22% increase over August 2019.  And condos/TICs had a 13.6% increase.  

Changes in average selling prices were mixed for single family homes and down for condos among the five configurations we survey:


It's clear that the large numbers of available inventory since May has impacted the condo/TIC market.  The usual after Labor Day bump up in inventory did happen.  6% more single family homes were added compared to 2019 and condos/TICs jumped 22%.

As expected, with the huge influx of new inventory there has also been lots of price reductions not seen in recent memory.  In the last three 14-day periods there have been over 150 price reductions for condos/TICs in each period.  And, if history repeats itself, the next two 14-day reporting periods should produce similar numbers.

For a full review got to our web site:  www.boldsf.com/Statistics for a complete review of this month's reports.


Wednesday, September 9, 2020

New Listing Market Watch - the end of summer market

 The number of new listings in the last two weeks eased off from recent highs in the prior six weeks although still above 500 at 524 compared to the prior two week period (553).  Compared to the same period last year (441) new listings were almost 20% higher.


The bulk of new listings continue to be in the condo market.  During the prior two weeks 339 new listings were added compared to 362 in the prior period and compared to 267 a year ago.  There were 185 new listings of single family homes compared to 191 in the prior period and compared to 174 a year ago.

In comparison, 28 single family homes went into contract and 97 changed status to "pending".  Similarly, 59 condos went into contract and 103 went into pending status. 

Similarly, the number of price reductions fell below the records set during the last six weeks.  


And again condos led the way with 149 price reductions compared to 167 in the prior period and compared to 22 a year ago.  Single family homes posted 34 price reductions compared to 48 in the prior period and compared to just 9 a year ago.

Since virtually all of this took place prior to Labor Day we'll be watching closely to see what happens in the next two weeks which, in a normal year, there would be a jump in new listings following the holiday.