Monday, April 22, 2019

New Listing Watch -- fewer listings, faster sales

New listings in the last 14 days are down about 10% compared to the previous period and compared to the same period last year.  Most of the reduction is in condos (165 new listings compared to 192 two weeks ago and compared to 189 a year ago). 


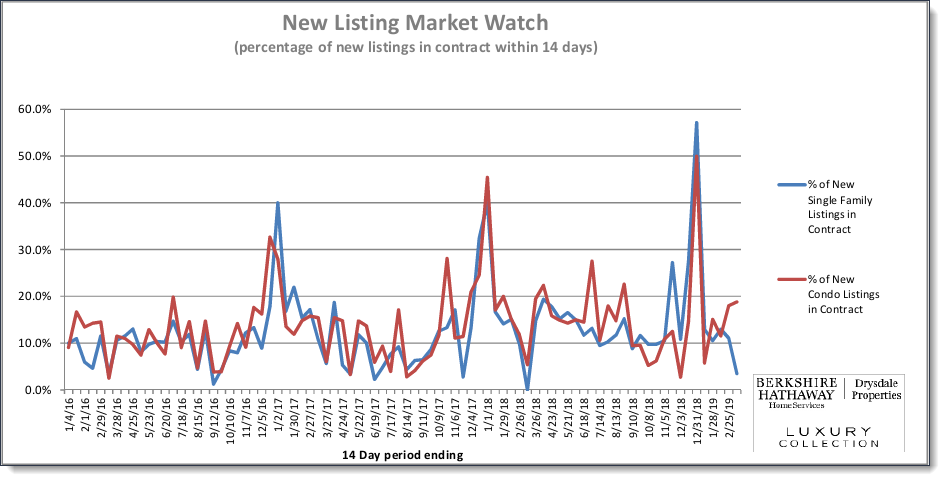
The number of new single family listings that went into contract in the same two week period has increased strongly compared to the prior period (18.8% vs 13.9%).  The increase for condos was modest at 24.8% vs 23.4%.


The number of price reductions is down compared to the previous period (8 vs 11 for single family homes and 20 vs 27 for condos) and compared to a year ago (8 vs 13 for single family homes and 20 vs 29 for condos).

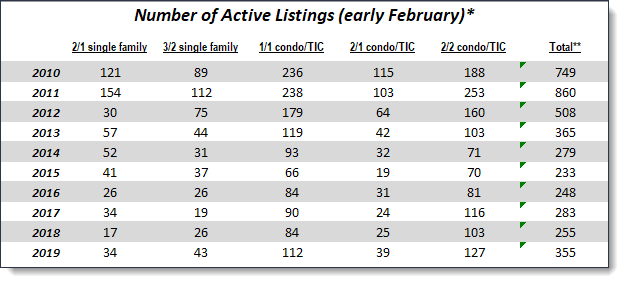
At the beginning of April the total number of active residential listings in the five categories we track* in San Francisco was 338 which is up about 11% compared to the same time last year but down compared to 2017 and 2016.

The full report can be found on our web site:
http://www.boldsf.com/Statistics%20test/Statistics.html


*Every month we survey sales and active inventory for five categories of condos and single family homes in San Francisco.  Those five categories comprise approximately 51% of residential sales in San Francisco.  The categories are:  2 bed/1 bath single family, 3 bed/2 bath single family, 1 bed/1 bath condo, 2 bed/1 bath condo and 2 bed/2 bath condo.

Thursday, March 28, 2019

New Listing Watch - after up comes down

New listings for the two week period ending March 25 were down slightly from the prior two week period (283 vs 289) and down significantly from the same period a year ago (283 vs 334).


Compared to last year both single family homes new listings and condo new listings were down almost 20%.

Of those new listings both condos and single family homes saw 16% go into contract during the same two week period.


Price reductions were down from the prior two week period (27 vs 34) and down compared to a year ago (27 vs 36).


The full report can be found at our web site.

Tuesday, March 12, 2019

New Listing Watch -- increasing after a pause

New listings during the last two weeks (ending 3/11/19) are up compared to the prior two week period (ending 2/25/19):  289 vs 242.  Most of the increase was in single family homes (114 vs 81).  Condos increased to 175 from 161.

Compared to the same period a year ago new listings were up (289 vs 252) with most of the difference in condos (175 vs 148).


With the big increase in single family home listings it's not surprising that the percentage of those new listings going into contract in the last two weeks is down to 3.5%.  For condos 18.9% of new listings in the last two weeks have gone into contract.


Price reductions for single family homes during the last two weeks have gone up slightly compared to the prior period (12 vs 10) while price reductions for condos has gone down from 28 to 22.  Compared to a year ago price reductions are up slightly (12 vs 9 for single family homes and 22 vs 18 for condos).


The full report can be found at our web site.

Monday, February 25, 2019

Number of Homes For Sale Up Compared To Last Year

We track the number of active listings on the market in San Francisco once a month, usually on the 8th.  Early in February, the number of active listings was significantly higher than a year ago (355 vs 255).

We also track five configurations of single family homes and condos.  The increase in active listings was seen in each of those five configurations.


The number of active listings was at its highest since 2013.

* Survey is usually done within 7 or 8 days after the beginning of the month.
** These five configurations represent approximately 60% of residential real estate sales in San Francisco.


New Listing Watch - Fewer Than Two Weeks Ago

The number of new listings during the past two weeks is down compared to the prior two week period (242 vs 264).  The drop was entirely in the single family home category (81 vs 108).  In contrast the number of new listings of condos increased slightly (161 vs 156).


Compared to the same period last year the number of new listings is also down (242 vs 283).  Again the difference is almost entirely in the single family home sector (81 vs 113).

The number of new single family home listings that went into contract in the same two week period is down compared to the prior two week period is down (9 vs 14) but up for condos (29 vs 18).


Price reductions are slightly higher compared to the prior period (38 vs 34) and higher than last year (38 vs 28).


The full report is available at our web site.