Monday, August 28, 2017

New Listing Watch - Summer doldrums continue, part 2

Not a lot has changed during the last two weeks which, if history is predictive, should be the last of the summer doldrums.  The number of new single family home listings is down slightly from the previous two-week period (79 vs 92) and compared to a year ago (79 vs 101).  The number of new condo listings is actually up compared to the prior two-week period (122 vs 108) and is the same as a year ago (122 vs 122).


But, as the graph above illustrates, we should expect to see significant increases in the number of new listings for both condos and single family homes by our next report in two weeks following the Labor Day weekend.

The percentage of new listings going into contract is also about the same as it was for the prior two week period (6.3% vs 4.3% for single family homes; and 4.1% vs 2.8% for condos).  However, for the same period a year ago those percentages were 12,9% and 14.8%.  


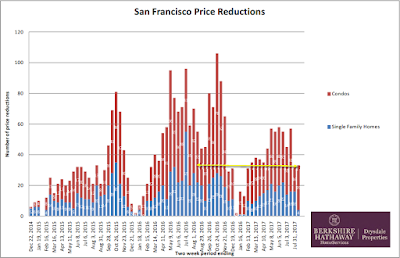
The number of price reductions is almost the same as the prior two-week period (5 vs 4 for single family homes; and 21 vs 29 for condos).  A year ago those numbers were much higher:  20 and 24 respectively).


Monday, August 14, 2017

New Listing Watch - Summer doldrums continue

Still in the middle of "summer" doldrums, new listings for the last two weeks totaled 200, approximately the same as the previous period and the same period a year ago (219 and 219 respectively.  If the usual annual trends hold true this year, we'll begin seeing an increase in new listings the week following Labor day.


Along with fewer new listings coming on the market, it's not surprising that the number of new listings going into contract is also at a low level for both single family homes and condos (4.3% and 2.8% respectively).  These levels are evening lower than the previous period (9.3% and 17.1%) but about the same as a year ago (4.4% and 4.7%).


Finally, the number of price reductions (4) is down for single family homes compared to the previous period and compared to a year ago (16 and 22 respectively).  It's a mixed picture for condo price reductions which saw 29 price reductions during the past two weeks compared to 16 during the previous period and compared to 33 a year ago.


Monday, July 31, 2017

New Listing Watch -- summer doldrums?


The number of new listings in the past two weeks (108 single family homes and 111 condos) was down noticeably compared to the prior two week period (91 single family homes and 152 condos) and down significantly compared to the same period last year (136 single family homes and 177 condos).

Also worthy of note, the number of new listings of condos and single family homes was approximately equal, something that hasn't happened since the beginning of 2016.

The percentage of those new listings in the last two weeks that went into contract was up compared to the prior period (9.3% vs 7.7% of single family homes and 17.1% vs 3.9% of condos).  Compared to a year ago the percentage of single family homes that went into contract in the same two week period remained virtually the same (9.3% vs 10.3%).  However, there was a significant jump in condos going into contract ( 17.1% vs 9.0%).


The number of price reductions compared to the prior period remained unchanged for single family homes (16) but dropped significantly for condos (16 vs 41).  Compared to the same period last year the number of price reductions dropped in both groups (16 vs 20 single family homes and 16 vs 39 condos).


Monday, July 17, 2017

New Listing Report - Summer Doldrums

New listings for the past two weeks jumped back up to more normal levels. There were 243 new listings (91 single family homes and 152 condos) compared to 158 (62 single family homes and 96 condos) during the previous two weeks and compared to 313 (136 single family homes and 177 condos) a year ago.

However, new listings are still running well below levels in 2016 and 2015.


The number of price reductions increased somewhat compared to the previous period (16 single family homes vs 14 and 41 condos vs 31).  Compared to a year ago price reductions are stable (57 vs 59 a year ago).


San Francisco 6 month review

Is the San Francisco real estate market one of the most expensive places to buy property?  After a review and analysis of the first six months of 2017 activity you can decide for yourself. 
First a few general data points.  42% of closed residential transactions were single family homes; 58% were condominiums/TICs/co-ops. 
Over 67% of residential sales have a sales price over $1million.  Available inventory is at a seven year low.  In 2010 at the beginning of July there were about 1,106 residential properties (single family homes and condos/TICs/co-ops) on the market.  At the beginning of July 2017 there were only 330.   When compared against typical monthly sales volume, this represents about three weeks of inventory for single family homes and four to seven weeks for condos.
When broken down into price ranges the single largest category of sales is the $1million to $1.5million range at 33%. Then comes the $800k to $999k range at 17.4% followed by $1.5million to $2million at 16.4%.  At the extremes of our market the $0 to $500k range accounts for only 2.2%.  The $2million to $2.5million range has 6.6% and the over $2.5million range accounts for 10.6%.
Looking at the five most popular residential configurations for more clarity, we track 3/2 and 2/1 (bedrooms/baths) single family homes, and in the condo category 1/1, 2/1 and 2/2 (bedrooms/baths). 
Property type**
# of sales
Average sale price (000s)
Low sale price (000s) ***
High sale price (000s)
Average days on market
Sale price premium*
Available inventory
2/1 single family
183
$1,067
$491
$2,513
42
121%
3 weeks
3/2 single family
189
$1,454
$659
$3,700
20
115%
3 weeks
1/1 condo
336
$791
$223
$1,570
34
105%
6 weeks
2/1 condo
151
$1,092
$342
$1,925
25
114%
4 weeks
2/2 condo
361
$1,342
$250
$3,055
33
106%
7  weeks

*Sale price divided by listing price.
** These five categories represent about 51% of the total residential sales as reported in the San Francisco Association of Realtors MLS.  Most new construction condo units being sold by the developer do not appear in the MLS. 
*** Most of the low sale prices were properties that have their original and resale prices restricted through various government programs designed to preserve affordable housing.
Current detailed reports can be found at www.boldsf.com/Statistics
And we do accept agent/broker referrals in San Francisco and surrounding counties.