Inventory
As it typical this time of year, the total number of new listings entering the market over the past two weeks has dropped -- 472 vs 606 in the prior two week period. The drop is seen for both single family homes (190 vs 236) and condos (282 vs 370).
But as the graph shows, we had substantially more new listings in the last two weeks compared to the same period a year ago: 190 single family homes vs 114 a year ago and 282 condos vs 176 a year ago.
As of Monday (11/2/2020) there were 1,803 active listings including 441 single family homes and 1362 condos/TICs. A year ago 924 active listings (303 single family homes and 621 condos).
Sales and Sales Prices
We're seeing a similar number of sales this year (October) compared to the same month last year. In fact total sales in October was actually 8% higher than a year ago (555 vs 512).
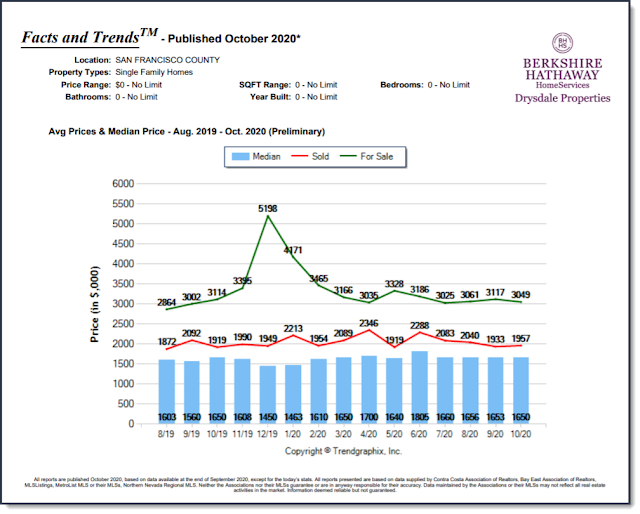
Median sales prices for single family homes have held steady over the past year. Median sales price in October this year was $1,650,000., unchanged from October 2019.
Median sales prices for condos have dropped 11.5% from $1,325,000 in October 2019 to $1,173,000 in October this year.


No comments:
Post a Comment