Tuesday, December 22, 2020

Last New Listing Market Watch before Christmas

Since July our residential real estate market has rebounded and indicates there is continued demand for San Francisco single family homes and condos. While demand remains relatively constant compared to last year, inventory is very different story.  Still too few single family homes and too many condos/TICs.  During the last 14-day Hot Sheet periods, the number of listings of single family homes is up 9% compared to the same period in 2019 while condos/TICs listings are up 142% compared to the same period in 2019.

Compared to the previous 14-day period single family homes are the same at 99.  Condos are up by 36% (123 to 167 units).  We still expect the 4th quarter will see the best quarter of 2020 in actual closings.

Average selling prices are falling for most configurations of homes that we survey with the notable exception of 3 bedroom, 2 bath single family homes which are averaging about 3% above 2019. 

It is also evident that, as usual, many units are being withdrawn presumably for at least 30 days and will reappear in the new year as “coming soon” or active with zero days on the market.

For the full report go to our website .


Tuesday, December 1, 2020

Post Thanksgiving; Pre Christmas

New listings coming onto the San Francisco residential real estate market in the last two weeks has reverted in some ways to "normal".  Normal in the sense that during the last 14 days the number of new single family home listings has declined by 39% compared to the prior two week period and condos/TICs declined by 46%.  Regardless of what the economy is doing every year we always see this kind of decline from Thanksgiving until after the new year.

But compared to the same period a year ago the number of new single family home listings coming on the market is up 130% and condos/TICs are up 131%.  So, not so normal.


Data also shows the number of sales for November (through 11/29) is up 10.4% compared to November last year.  (Single family homes are up 16% and condos/TICs are up 7%.


The number of price reductions in the last 14 days are the lowest since July, 2020.  There were 21 price reductions of single family homes and 79 reductions of condos/TICs.


The full reports can be found at our website.

Friday, November 20, 2020

Where are we compared to last year?

 A new report we just published that gives some indicators on the direction of the residential real estate market over the past three months and a comparison to October 2019.

Average selling price for single family homes in October was down 1% compared to September but up 1% compared to a year ago. 

For condos the average selling price in October was down 5% compared to September and down 12% compared to October last year.


There is a large inventory of condos on the market although we expect to see fewer new listings come on the market through the holidays until after the new year.  For buyers this time of year can present opportunities with less competition.

The full report is at our web site.


Thursday, November 19, 2020

Parents help kids buy their first home?

The question of how parents can help their kids with their first home purchase comes up frequently.  According to JVM Lending there are seven approaches:

1) Gift of Funds.

2) Loans.

3) Co-Signing.

4) Second Home.

5) Kiddie Condo.

6) Investment Property.

7) Equity Share.

More details

Each of these approaches has potential pitfalls and consequences you need to be aware of before proceeding.  As always, consult your tax and real estate professionals.


Wednesday, November 4, 2020

So Where Are We?

Inventory

As it typical this time of year, the total number of new listings entering the market over the past two weeks has dropped -- 472 vs 606 in the prior two week period.  The drop is seen for both single family homes (190 vs 236) and condos (282 vs 370).


But as the graph shows, we had substantially more new listings in the last two weeks compared to the same period a year ago:  190 single family homes vs 114 a year ago and 282 condos vs 176 a year ago.

As of Monday (11/2/2020) there were 1,803 active listings including 441 single family homes and 1362 condos/TICs.  A year ago 924 active listings (303 single family homes and 621 condos).

Sales and Sales Prices

We're seeing a similar number of sales this year (October) compared to the same month last year.  In fact total sales in October was actually 8% higher than a year ago (555 vs 512). 

Median sales prices for single family homes have held steady over the past year.  Median sales price in October this year was $1,650,000., unchanged from October 2019.  

Median sales prices for condos have dropped 11.5% from $1,325,000 in October 2019 to $1,173,000 in October this year. 


Thursday, October 8, 2020

Highlights from Monthly and 3rd Quarter Reports

We've just posted our regular collection of monthly reports along with third quarter reports for residential listings and sales in San Francisco, Marin and Sonoma counties.  Also included are our Biweekly New Listing Report for San Francisco and weekly Tri-County report. The full reports can be found at our website:  www.boldsf.com/Statistics

Here are some highlights:

San Francisco

  • Every two weeks for the past four months San Francisco has added more than 500 new listings of single family homes, condos and TICs.  For the two weeks ending October 5 we added 652 new listings.  That compares to 403 during the same period last year.  The bulk of new listings are condos with 425 added in the last two weeks compared to 264 a year ago.
  • Every two week period for the past sixteen weeks we've seen 100+ price reductions posted for condos.  During the two weeks ending October 5 there were 208 price reductions compared to just 73 a year ago.
  • As of October 5 there were 1,401 condos listed for sale.  For September there were 308 condo sales that closed compared to 191 in September of 2019.

  • The conclusion seems to be there are more than the normal number of buyers for condos but they are substantially outnumbered by more and more listings coming on the market.
Marin

  • Inventory remains a problem in Marin county.  In September 240 single family homes closed escrow.  As of October 6 there were only 336 single family homes on the market -- barely a month's supply.
  • For the third quarter this year smaller single family homes (3 bedrooms or less) are selling for premiums above those for the same quarter last year. Premiums for 4 bedroom homes are slightly below last year's level.
  • The number of sales was up in the third quarter of the six configurations of single family homes we track compared to the same quarter a year ago.

Sonoma

  • Inventory is also a problem in Sonoma where 517 single family homes closed escrow in September and, as of October 5, there were 643 on the market.
  • For the six configurations of single family homes we track, all posted sales for the third quarter above those of the third quarter last year with the exception of 4 bedroom, 3 bath homes.
  • Premiums were also up in all of the configurations except the two largest.

Tri County
  • The number of sales of condos and single family homes in all three counties was up in September compared to a year ago with the exception of condos in Sonoma County.

Friday, October 2, 2020

Global Real Estate Bubble Index

The large, global investment bank UBS has put out it's annual Global Real Estate Bubble Index for 2020.  It lists 25 cities around the world and classifies them as Bubble Risk or Overvalued, Fair Valued, or Undervalued.  Of the 25 cities there are five in the US -- Los Angeles, San Francisco, New York, Boston and Chicago.

San Francisco is in the Overvalued group but trending down over the past three years:

Barrons describes the index this way when discussing the seven cities most at risk of a housing investment bubble:  "Faced with high price-to-rent ratios and uncertain rental price growth, investors searching for a buy-to-let home may want to look elsewhere."

Keep in mind this index is focused exclusively on residential real estate as investment.  So if you're not planning on renting your property the index probably isn't especially relevant -- but it is interesting.

Tuesday, September 22, 2020

New Listing Market Watch -- record numbers of new listings (and price reductions)

Just when you might have thought things might settle down now that we're well past the Labor Day holiday, the number of new listings in the past two weeks has increased to levels we haven't seen in at least seven years.  Total new listings in the last two weeks were 718 of which 259 were single family homes and 459 were condos.  

That total of new listings is 142% of the same period last year and 137% compared to the prior two week period.  

Price reductions have also jumped -- 53 for single family homes and 173 for condos.  

Those numbers are 171% of the number of price reductions for single family homes a year ago and 339% for condos.

You might conclude from these numbers that sales have taken a nose dive.  But one of our other reports shows that the number of closed sales so far for September have exceeded the number that closed for entire month of September last year (140 compared to 127).  Closed sales of condos so far this month are 187 compared to 191 for the entire month last year.  So it appears that the sales rate hasn't changed significantly compared to a year ago -- it's just inventory that has climbed so dramatically.

The full reports can be found at out web site:

www.boldsf.com/Statistics


Thursday, September 10, 2020

August Number of Sales and Average Sales Prices

The August 2020 residential real estate market in San Francisco showed some remarkable resilience despite Covid-19.  The number of single family homes closed sales showed a 22% increase over August 2019.  And condos/TICs had a 13.6% increase.  

Changes in average selling prices were mixed for single family homes and down for condos among the five configurations we survey:


It's clear that the large numbers of available inventory since May has impacted the condo/TIC market.  The usual after Labor Day bump up in inventory did happen.  6% more single family homes were added compared to 2019 and condos/TICs jumped 22%.

As expected, with the huge influx of new inventory there has also been lots of price reductions not seen in recent memory.  In the last three 14-day periods there have been over 150 price reductions for condos/TICs in each period.  And, if history repeats itself, the next two 14-day reporting periods should produce similar numbers.

For a full review got to our web site:  www.boldsf.com/Statistics for a complete review of this month's reports.


Wednesday, September 9, 2020

New Listing Market Watch - the end of summer market

 The number of new listings in the last two weeks eased off from recent highs in the prior six weeks although still above 500 at 524 compared to the prior two week period (553).  Compared to the same period last year (441) new listings were almost 20% higher.


The bulk of new listings continue to be in the condo market.  During the prior two weeks 339 new listings were added compared to 362 in the prior period and compared to 267 a year ago.  There were 185 new listings of single family homes compared to 191 in the prior period and compared to 174 a year ago.

In comparison, 28 single family homes went into contract and 97 changed status to "pending".  Similarly, 59 condos went into contract and 103 went into pending status. 

Similarly, the number of price reductions fell below the records set during the last six weeks.  


And again condos led the way with 149 price reductions compared to 167 in the prior period and compared to 22 a year ago.  Single family homes posted 34 price reductions compared to 48 in the prior period and compared to just 9 a year ago.

Since virtually all of this took place prior to Labor Day we'll be watching closely to see what happens in the next two weeks which, in a normal year, there would be a jump in new listings following the holiday.


Monday, August 24, 2020

New Listing Market Watch - new normal?

 New residential listings (553) continue to vastly outpace new listings in the same two-week time period a year ago (207). It continues the trend we've seen over the past five two-week periods.

65% of new listings were condos. Compared to the previous period new condo listings were down slightly (362 vs 391).  New condo listings were three times what there were in the same period a year ago (363 vs 122).  

New listings of single family homes were up compared to the prior period (191 vs 171) and more than double compared to the same period a year ago (191 vs 85).

Historically, August would see a drop off of new listings with sellers and listing agents holding off until after Labor Day.  

The number of single family home listings that went into contract in the last two weeks as a percentage of new listings is down to 14.7%.  That's the lowest it's been in 14 weeks but it's well above the same period a year ago (14.7% vs 11.8%).

For condos the percentage is even lower at 9.4%.  That's up slightly compared to the prior period (9.4% vs 7.9%) but only half of what it was a year ago (9.4% vs 20.5%).

Price reductions remain at historic highs led almost entirely by condos.  There were 48 single family homes posting price reductions in the last two weeks compared to 40 in the prior period and compared to only 8 during the same period a year ago.  Condos posted 167 price reductions compared to 170 in the prior period and only 19 a year ago.


Overall the number of single family homes that closed escrow in the last two weeks is up  approximately 12% compared to a year ago (87 vs 78).  For condos the number of closings is off by 12% (85 vs 97).


Monday, August 10, 2020

New Listing Market Watch - WOW2

More listings, more price reductions.  The number of new listings in the last two weeks almost reached the record level of the prior two week period with 562 new listings (171 single family homes and 391 condos).  391 condo listings is the highest we've seen in a two week period since we've been keeping these records, eclipsing the previous record just set in the prior period of 365.

Compared to the same period a year ago total new residential listings are up 273% (562 vs 206).  There were 171 new listings of single family homes compared to 86 a year ago and 391 condos compared to 120 a year ago.

The number of price reductions has also increased compared to the prior two week period.  In the last two weeks there were 40 price reductions on single family homes vs. just 5 in the prior period.  There were 170 condo price reductions compared to 151 in the prior period.  Compared to a year ago there were just 9 single family home price reductions and just 17 for condos.


In summary, we have had five two-week period with over 300 new listings of condos and over 100 condo price reductions in the last four two-week periods. 

See the full report at our web site.


Tuesday, July 28, 2020

New Listing Market Watch -- WOW

To sum up, everything is double what it was a year ago except single family homes price reductions.

There were 565 new residential listings in the last two weeks compared to 238 in the same period a year ago. Of those 565, 200 were single family homes and 365 were condos -- each more than double compared to a year ago.  This is the highest number of new listings for a two week period since at least 2014 when we first started tracking.

Even compared to the prior period new listings of single family homes rose from 177 to 200 and condos rose from 320 to 365. 


Condo price reductions was the other big number -- 151 compared to 25 a year ago and compared to 107 during the prior two week period.  Price reductions for single family homes were down:  only 5 in the last two weeks compared to 20 a year ago and compared to 39 in the prior two week period.


23% of new single family home listings went into contract compared to 18% in the prior period and compared to 18% a year ago.  Only 9% of condo new listings went into contract compared to 17% in the prior period and compared to 15% a year ago.


The full report can be found at our website.

Sunday, July 26, 2020

San Francisco Residential Market by Price Range

Our Monthly Summary report and analyses track specific configurations of single-family homes and condos (e.g. 2 bedroom, 1 bath) with the largest number of sales.  The luxury end of our market was not truly represented in that survey and, therefore, we track residential sales by price range.  We have been tracking San Francisco residential sales by price range for about 3.5 years now. 

From our July 5th report:  for single family homes there were no homes that sold below $500K.  The largest number of sales was between $1m-$1.5m where approx. 30% of all single-family home sales were recorded.  The $1.5-$2m price range follows with 20% of closed sales.  The average days on market was 25 and 22 days respectively.
Also, the premium (selling price divided by asking price) was 112% and 111% respectively.
The next two higher price ranges ($2-$2.5m and $2.5-$3.5M) represent 11% and 13% of the total market.


80% of all single-family home sales are priced between $1M-$3.5M.

Following the generally accepted guidelines for luxury single family homes (the top 10% of the market by price) in San Francisco that would be homes priced at $3.5M and above.


Our condo/TIC market is about 56% of all residential MLS-reported sales.  There have been 29 condos that have sales prices below $500K; all but 8 of those sales were “below market” sales where the price is controlled/constrained by various city programs.

30% of all condo sales are in the $500K-$999K range.


The largest category price range is the $1M-$1.5M with 34% of all condo sales.  The second largest category with 21% of sales is $1.5M-$2M.  Average days on market for these two categories were 31 and 43 days respectively with premiums of 101% and 103%.
55% of our condo market is between $1M-$2M.

To qualify as a luxury condo in San Francisco (top 10% of the market) pricing would be $2.25M and above.

The full report is available on our web site.


Monday, July 13, 2020

New Listing Market Watch - new listings continue to soar

This is the second two-week period where new listings topped 200% or more compared to the same period a year ago.


There were 497 new listings in the last two weeks (177 single family homes and 320 condos) compared to 241 new listings (103 single family homes and 138 condos) in the same period a year ago.

For comparison, during the last two weeks only 122 properties closed escrow (56 single family homes and 66 condos) -- only 24% of the number of new listings.

This was also the fourth two-week period in a row where price reductions were double what they were in the same periods a year ago.


The full report is on our web site along with other reports we publish.

Tuesday, July 7, 2020

Tale of Two Markets

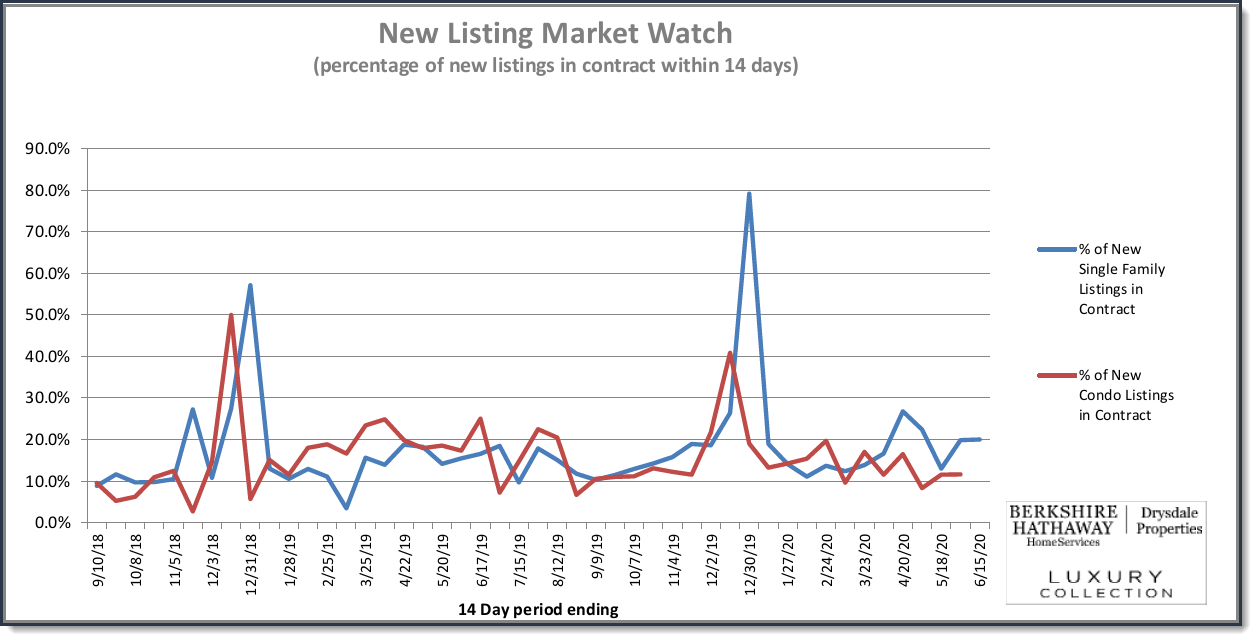
The San Francisco residential real estate market continues with an ever increasing number of new listings.  John and I have been tracking these "hot sheet" data every two weeks for at least the last seven years and the last 14 day period, June 15 thru June 29, has the highest number of new listings that we've seen.  Year over year during the same 14 day period total inventory was 236 last year and 520 this year, a 220% increase.  Compared to the prior two week period there was an 11% increase.

The San Francisco market has become a rather unique community as 70% of residential properties are condos/TICs and only 30% are single family homes.  With limited available land the percentage of condos/TICs will continue to grow with single family homes becoming an even scarcer commodity.

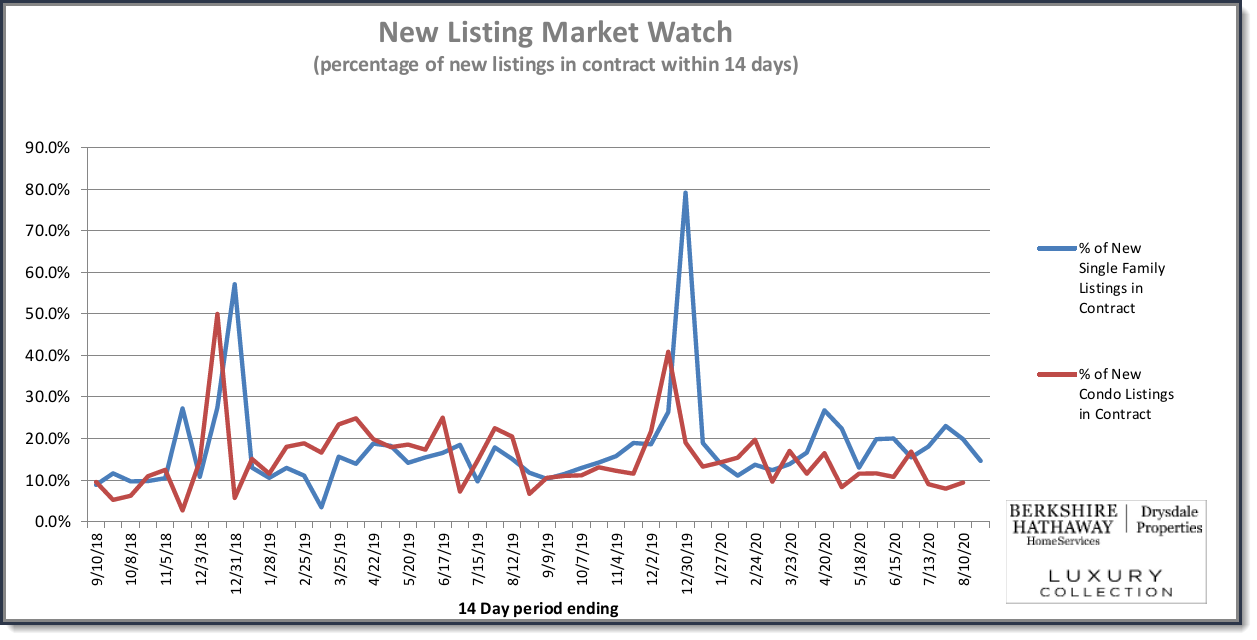
While the total number of new listings have been record breaking the distribution between single family homes and condos/TICs is well worth noting.  64% of the listings were condos/TICs with single family homes accounting for the other 36%.

The single family home market showed an increase of available inventory to about 10 weeks but 2 bedroom/1 bath and 3 bedroom/2 bath categories went up to only 4 and 7 weeks respectively.  June closings so far show that 26 2/1 single family homes closed with an average selling price of $1.26 million, 21 days on market, and premium (selling price/listing price) of 110%.  There were also 30 3/2 single family homes that closed at an average selling price of $1.6 million, 18 days on market, and premium of 106% (selling price/listing price).

We should also quickly note the numbers of luxury homes has also increased and available inventory has risen to about 3 months for homes priced between $2.5 - $5 million and 6 months for homes priced over $5 million.

The condo market place is entirely different.  During the same 14 day period a year ago there were 128 new listings compared to 333 this year -- a 260% increase.  The biweekly to biweekly comparison is only 7% increase.

Typical for San Francisco you would find available inventory running from 4-6 weeks.  With the huge numbers of properties coming on the market in just the last three 2-week reporting periods new inventory has totalled 913 units.  Available inventory for homes priced below $1.5 million is 8-10 weeks; $1.5-$2.5 is 12 weeks; $2.5-$4.5 is 20 weeks; properties above $4.5 million jumps to 40 weeks.

Sold condos in June results are as follows.  For the two largest categories of condominiums (1/1 and 2/2) there were 29 closed 1/1 units with an average selling price of $893k with days on market of 35 and a premium of 100%.  For 2/2 units, 39 closed with an average selling price of $1.6 million, 37 days on market and a premium of 99%.

While buyers will find a broader array of residential properties available single family homes remain in demand and it appears that premiums will be between 2-8% rathether than the 10-20% we've seen previously.  The condo market is under pressure from the sheer number of listings and we expect to see some leveling or lowering of prices given the history number of price reductions we've seen over the past 8 weeks.

Tuesday, June 30, 2020

New Listing Market Watch - record number of new listings (condos) and price reductions (condos)

The headline is the story.  In the last two weeks there were 333 new listings of condos, a record for the seven years we've been keeping track.  (As a reminder, these are almost entirely resale properties as reported on the MLS.  New construction condos being sold by the developer are not included except for a handful that some developers put on the MLS essentially as advertising.  Also not included would be any off-market sales.)

In each of the last four 2-week periods (covering two months) we have had 300 or more new condo listings except for one period when there were "only" 277. 

The latest two week period of 333 compares to 310 the prior period and compares to 128 a year ago.

We had 187 new listings of single family homes compared to 160 the prior period and compared to 108 a year ago. 


So it won't come as much of a surprise that we also had 101 price reductions on condos during the past two weeks compared to 84 in the prior period and compared to 84 and 64 in the prior two periods.  A year ago we had 32.

There was also an increase in the number of price reductions of single family homes:  43 compared to 33 in the prior period and compared to 20 a year ago.


The number of properties that went into contract in the last two weeks held steady for both single family homes and condos.  29 single family homes went into contract compared to 32 in the prior period and compared to 20 a year ago.  36 condos compared to 36 in the prior period and compared to 32 a year ago. 

Expressed as a percentage, here's a graph showing number of properties going into contract as a percentage of the number of new listings.


And finally, just to drive the point home, here is a graph showing new listings in two week increments over the past five years.  It's a little busy but it's easy to see how out of the normal range condo listings have been recently.


Monday, June 15, 2020

Update: Are renters having trouble with their rent payments?

In the last two months not much has changed in terms of the percentage of renters who pay their rent on time.  These graphs add the two latest months reporting (May and June) to the three months reported earlier.

The first graph shows data through the first week of June:


This graph shows full month data through the end of May:


Information is provided by the National Multifamily Housing Council whose membership is comprised of owners of large properties.

"These are trying times for the country, and we are reminded on a regular basis how crucial safe and secure housing is during a period of uncertainty and upheaval, so we are glad to see that residents who live in professionally managed properties continue to pay their rent,” said Doug Bibby, NMHC President. “While our Rent Payment Tracker metric continues to show the resilience and strength of the professionally managed apartment industry, it does not necessarily tell the whole story, as it doesn’t capture rent payments for smaller landlords or for affordable and subsidized properties, and according to Harvard, more than half of renters with at-risk wages due to the pandemic live in single-family and small multifamily rentals with 2–4 units."

Here's the link to their full report.

New Listing market watch-- condos surge, price reductions increase

The number of new listings to come on the market in the last two weeks continues to increase compared to prior periods and compared to the same time period last year.


Here's another look comparing new listings this year compared to prior years.  It's apparent that the number of new listings of condos is (and has been for the past few weeks) substantially higher than any of the past 5 years.  New listings of single family homes has been mostly in the same range as prior years.


For the past six weeks (three two-week periods) new listings have significantly surpassed the same periods a year ago.  The majority of these new listings have been in the condo market.

There were 160 new listings of single family homes in the last two weeks compared to 156 in the prior period and compared to 127 during the same period a year ago.  There were 310 new listings of condos compared to 277 in the  prior period and compared to 196 a year ago.

Overall, total new listings (single family and condos) were up 46% compared to a year ago.

At the same time, price reductions are up.


The number of new listings in contract has remained steady.  During the past two weeks 32 single family homes went into contract compared to 31 in the prior period and compared to 21 a year ago.  For condos, 36 went into contract compared to 32 in the prior period and compared to 34 a year ago.


Tuesday, June 9, 2020

Condo buyers market:

The San Francisco real estate market is back and initial indicators are signaling a new cycle is upon us, particularly in the condo/tic segment. Inventory has surged back in numbers that buyers will embrace — condo sellers not so much. 

In the last two years condo inventory has usually been 4-6 weeks of inventory. On June 1 1/1, 2/1, and 2/2 condo configurations have 23, 14, and 26 weeks of inventory respectively. All condo inventory is up to 24 weeks.

Single family homes have seen a more modest increases in inventory. Total inventory has risen to 10 weeks but 2/1 and 3/2 configurations have only 3 weeks and 6 weeks of inventory respectively.

TBD — are we in a buyers market for condos?

Tuesday, June 2, 2020

Sales Down (a lot)

It will come as a surprise to no one that residential sales in San Francisco are down.  But the size of the decline is unprecedented.


Sales during the first five months of the year are only 63% compared to the same period last year (1295 vs 2040).

That's only slightly better than the first five months of 2008 in the depths of the great recession (1295 vs 1265).


New Listing Market Watch - new listings ease, price reductions surge

New listings of single family homes during the past two weeks were down compared to the prior two week period (156 vs 184) but up compared to a year ago 156 vs 123). 

A similar story with new listings of condos which were down compared to the prior period (277 vs 300) but up substantially compared to a year ago (277 vs 167).


Almost 20% of new single family home listings went into contract during the past two weeks compared to 13% during the prior period and compared to 15% a year ago.  For condos, 12% went into contract compared to 8% during the prior period and compared to 19% a year ago.


There was a jump in price reductions during the past two weeks.  30 single family homes posted price reductions compared to 22 during the prior period and compared to only 6 a year ago.  Condos posted 64 price reductions compared to 35 in the prior period and compared to just 6 a year ago.


Tuesday, May 19, 2020

New Listing Watch - lots more listings

New listings of single family homes during the last two weeks were 30% higher compared to the same period a year ago (184 vs 141).  New listings for condos were at 69% higher than a year ago (300 vs 178).  Compared to the prior two week period new listings for single family homes were up 59% (184 vs 116); new listings for condos were up 60% (300 vs 188).


As is apparent from the graph above, the last two weeks saw the largest number of new listings compared to any two week period in the last six years except for the two week period ending 9/23/2019.

The number of listings that went into contract when down to 13% for single family homes and 8.3% for condos -- not surprising given the number of new listings.


The number of price reductions has doubled compared to the prior period for single family homes (22 vs 11) and almost doubled compared to the same period last year (22 vs 12).  Condo price reductions increased by 67% compared to the prior period (35 vs 21) and by 40% compared to the same period last year (35 vs 25).


Now the question is "will buyers return in the same proportion"?

Stay tuned.

[Edited to correct percentages in the first paragraph. 5/21/20]

Tuesday, May 5, 2020

New Listing Watch -- back to the old normal?

What a difference two weeks makes, especially when it contains a "modified" shelter-in-place order that loosens previous restrictions on real estate transactions.

Two weeks ago we were reporting new listings down by more than 50% compared to the same period a year ago.  Today's report shows new listings back up to 86% of a year ago (304 vs 384) and more than twice what they were compared to two weeks ago (304 vs 164).


The number of price reductions increased as well:  11 single family homes had their asking price reduced compared to 7 two weeks ago and compared to 7 a year ago;  there were 21 condo price reductions compared to 7 two weeks ago and compared to only 4 a year ago.


We'll have to wait to see if sales keep pace with the increase in listings.  But it's encouraging to see that the number of new listings going into contract held at 26 single family homes compared to 15 two weeks ago and compared to 27 a year ago.  Similarly, 31 condos went into contract compared to just 9 two weeks ago and compared to 41 a year ago.


A full copy of the report can be found at our web site:
www.boldsf.com/Statistics


Thursday, April 23, 2020

Are renters having trouble with their rent payments?

Interesting statistics published by the National Multifamily Housing Council to gauge what effect the Covid-19 shelter-in-place orders are having on rent payments:


Based on figures gathered nationally by the National Multifamily Housing Council covering in its survey of 11.5 million professionally managed apartment units.

So far only a 4% change from last month and last year.

May may be different.