Wednesday, December 20, 2017

New Listing Watch -- last for this year

We've about reached the low point of the year for listings. 


Following the usual pattern for this time of year the number of new listings for the past two weeks is at its lowest level except for the first week of January.  Total new listings of 98 is well below the previous two week period of 141 but slightly higher than last year at this time (80).

Conversely, the percentage of new listings going into contract during the same two week period is at its highest point except for the beginning of January (12 of the 37 single family homes or 32% and 15 of 61 condos or 25%).


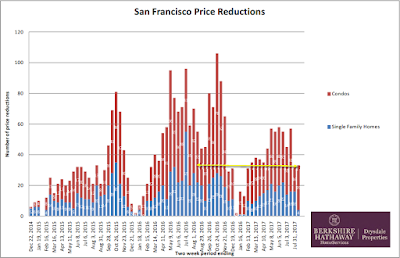
The number of price reductions is down from the previous period (1 single family home and 10 condos) and down compared to the same period last year (11 single family homes and 20 condos).


Thursday, December 7, 2017

Unusual Number of Below Asking Sales?

Naturally we keep close track of listings and sales around our two office locations -- 1715 Polk St. and 2324 Market St. -- and we post a list of sales in our office windows each month.  Here are the posters:
Market St. neighborhoods
Polk St. neighborhoods

There was something unusual that caught my eye in the November sales lists.  The percentage of listings that sold for under asking in the neighborhoods around Polk St. was approximately double around the Market St. office:  38% vs 14%.  (11 of 29 for Polk St. vs 5 of 35 at Market St.

I haven't gone back to check (I will and I'll update this post) but this seems an unusual situation from two perspectives.  First, we're used to most listings selling for over asking -- this is a city-wide phenomenon.  And more locally, although the total number of sales around each office varies from month-to-month, there are usually only a small number that sell for under asking.  Having more than a third of listings sell for under asking around the Polk St. office is very unusual.


Tuesday, December 5, 2017

Bi-weekly New Listing Watch

Not surprisingly, the number of new listings during the past two weeks is down compared to the prior period (141 compared to 168) although up a little compared to the same period a year ago (141 compared to 130). 


There was an uptick in new listings which went into contract in the same two week period -- 13% of single family homes new listings and 21% of condo new listings.  During the prior two week period only 3% of single family homes and 12% of condo new listings went into contract. 


There were only 5 price reductions of single family homes and 18 condo price reductions during the past two weeks compared to 12 and 37 during the prior two week period and compared to 10 and 19 a year ago.


The downward trend for new listings should continue through the New Year and then begin to pick up starting the second week of January.

Wednesday, November 22, 2017

Staging tips

I came across an infographic with some of the best suggestions for staging your home for sale whether you're using a professional stager or not.  The original article is here.


New Listing Watch -- fewer new listings and fewer price reductions

Listings continue to follow the annual path of fewer listings as we approach the holidays.  Total new listings in the last two week period was 168 compared to 177 during the same period a year ago.  If the trend of previous years repeats, we will see a continued decline in new listings until after the first of the year.  Both single family homes and condos are affected.  During the most recent two week period there were 72 new single family home listings compared to 75 last year.  For condos there were 96 new listings compared to 102 last year.


Here's a different view that shows we're following the same track as the last two years.  (This trend goes back more than two years but trying to show that on a line graph just gets too busy):


Not surprisingly, the number of new listings going into contract in the same two week period has dropped:


The number of price reductions is down compared to the same period a year ago.  For single family homes there were 12 price reductions during the latest two week period compared to 19 for the same period a year ago.  For condos there were 37 compared to 46 a year ago.


Happy Thanksgiving!

Monday, November 6, 2017

New Listing Watch - it's downhill from here

This time of year we begin seeing fewer and fewer new listings until we hit the bottom just after New Years.  Total new listings for the past two weeks is just about the same as the same period last year:  282 vs 287.  That's down significantly compared to the prior two weeks:  282 vs 320.


And you can see from the above graphic where we're headed.

What's a little different this year vs last year at this time is the number of price reductions which is down.  For single family homes there were 18 price reductions during the last two weeks compared to 26 a year ago.  For condos there were  35 price reductions compared to 56 in the prior period.  Compared to a year ago the difference is 18 single family homes price reductions vs 26 a year ago.  For condos there were 35 compared to 62 a year ago.


A higher percentage of new single family homes listings went into contract in the same two week period compared to the prior period (17% vs 13%) but for condos fewer new listings went into contract than in the previous period (11% vs 28%).


Saturday, October 21, 2017

Listing Photo Tip

Photos, arguably, are one of the most important aspects of real estate listings.  They are what potential buyers and buyers agents use initially to decide whether a property is worth spending further time to consider or whether they will just move on to the next property on the search results list.

Many listing agents understand this and demonstrate how important photos are by hiring a professional photographer.  But then they spoil the benefit of quality photos by making one small mistake.  They take a vertically oriented photo (taller than wide) and use it as the main/first photo in the listing.  Here's what happens when that photo is displayed on the MLS and other property search engines.  In going through new listings today I ran across several examples.  Here's one:

First, here is what the photo is supposed to look like:


Here's how it appears on the MLS:

The proportions of the photo are altered so that it is stretched to fit the predetermined size and layout the MLS imposes so the proportions of the property are incorrect -- looks like a wide, squat house.

Here's how it appears on Realtor.com:

The proportions are OK but, in order to fit the photo into their predetermined layout they have cropped the top and bottom.

Here's how it appears on Trulia:

Trulia also crops the photo but to an even greater extent.

Tip:  if you don't want the main photo of your listing to be mangled by search engines (over which you have no control), always use a horizontally oriented photo (wider than tall).  You may not avoid all the distortions introduced by the search engines but you'll make a better first impression.

(I've blurred out identifying information in these photos because the point here is to provide helpful information, not to embarrass the listing agent.  This property happens to be a multi-million dollar listing by an experienced and well-respected local agent but this problem can happen to anyone.)

Monday, October 9, 2017

New Listings Heading Down

As we speculated two weeks ago, we seem to have passed the peak of new listings for the year.  Total new listings for the past two weeks is down compared to the previous two weeks (340 vs 403).  Most of the decrease was in condos (189 vs 241) with single family homes remaining steady (151 vs 162).

Compared to the same period a year ago total for the past two weeks is down (340 vs 370).

There is every reason to believe we'll follow the same track for the rest of this year as we did in the previous two years.


With new listings down, the percentage of new listings going into contract in the same two week period has ticked up both for single family homes and condos compared to the previous two weeks and the same period a year ago.


Price reductions have increased for condos compared to the previous period (49 vs 34) but about the same during the same period a year ago (49 vs 46).  Price reductions for single family homes remained essentially the same compared to the previous period (18 vs 17) but are down compared to a year ago (18 vs 25).


If this year is similar to 2016 condo buyers may see a significant number of price reductions during the next two weeks.

Monday, September 25, 2017

Peak new listings for the fall year?

For the most part the "new listing" part of the market continues to follow the track set last year.  The number of new listings in the last two weeks is the largest this year and comparable to the same period last year (403 vs 391).


Compared to the previous two week period new listings are up slightly (162 vs 155 single family homes and 241 vs 228 condos).

The percentage of new listings going into contract within the same two week period is up slightly compared to the previous two weeks (8.6% vs 6.5% of single family home new listings and 7.5% vs 6.1% of condo new listings) suggesting that even with a peak of new listings there is still competitive demand.


The number of price reductions is up slightly compared to the previous two week period (17 vs 11 for single family homes and 34 vs 31 for condos).  However, compared to the same period last year the number of price reductions is down (17 vs 21 for single family homes and 34 vs 54 for condos).


If this last year's experience is predictive of the remainder of 2017 the last two weeks will be the peak of new listings for the year with each following two week period showing fewer and fewer new listings until after the first of the new year.


Christmas is only three months away!

Monday, September 11, 2017

Jump in new listings - as predicted

Right on time, as predicted, new listings have increased dramatically in the last two weeks.  Total new listings were 383 compared to 201 in the prior two week period.  For the same period a year ago new listings were 368.  The increase was evenly split between single family homes (155 vs 79 in the prior period) and condos (228 vs 122).


As can be seen from this graphic, this jump in new listings happens every year post Labor Day.


The percentage of new listings going into contract remained unchanged for single family homes compared to the prior period (6.5% vs 6.3%) but is up significantly compared to a year ago (6.5% vs 1.3%).  For condos 6.1% of new listings went into contract compared to 4.1% for the prior period and 3.9% a year ago.


The number of price reductions increased for single family homes to 11 compared to 5 in the prior period and 10 a year ago.  For condos, there were 31 price reductions compared to 21 for the prior period and 35 a year ago.


Friday, September 8, 2017

Are Buyers Finally Telling Sellers "No" to High Asking Prices?

At the beginning of each month we post a list of sales in the surrounding neighborhoods of our two offices (1715 Polk St. and 2324 Market St.) for the previous month.

August is traditionally a slow month for residential sales in San Francisco but something interesting seems to be happening in the Nob Hill, Russian Hill and Civic Center/Van Ness neighborhoods -- the number and percentage of sales closing at under asking prices is going up.

For August 2017 there were 17 residential sales in the three neighborhoods.  6 of those sales closed at below asking price -- 35%.  For August last year the numbers were 17 sales, 3 below asking -- 18%.

For the previous month (July 2017), there were 22 sales, 2 under asking -- 9%.


Admittedly the numbers are small and may not be indicative of a trend but we'll keep watching.

In the neighborhoods surrounding our Market St. office, the trend seems to be in the opposite direction.  This August only 6% of sales were under asking.  A year ago it was 19%.


Monday, August 28, 2017

New Listing Watch - Summer doldrums continue, part 2

Not a lot has changed during the last two weeks which, if history is predictive, should be the last of the summer doldrums.  The number of new single family home listings is down slightly from the previous two-week period (79 vs 92) and compared to a year ago (79 vs 101).  The number of new condo listings is actually up compared to the prior two-week period (122 vs 108) and is the same as a year ago (122 vs 122).


But, as the graph above illustrates, we should expect to see significant increases in the number of new listings for both condos and single family homes by our next report in two weeks following the Labor Day weekend.

The percentage of new listings going into contract is also about the same as it was for the prior two week period (6.3% vs 4.3% for single family homes; and 4.1% vs 2.8% for condos).  However, for the same period a year ago those percentages were 12,9% and 14.8%.  


The number of price reductions is almost the same as the prior two-week period (5 vs 4 for single family homes; and 21 vs 29 for condos).  A year ago those numbers were much higher:  20 and 24 respectively).


Monday, August 14, 2017

New Listing Watch - Summer doldrums continue

Still in the middle of "summer" doldrums, new listings for the last two weeks totaled 200, approximately the same as the previous period and the same period a year ago (219 and 219 respectively.  If the usual annual trends hold true this year, we'll begin seeing an increase in new listings the week following Labor day.


Along with fewer new listings coming on the market, it's not surprising that the number of new listings going into contract is also at a low level for both single family homes and condos (4.3% and 2.8% respectively).  These levels are evening lower than the previous period (9.3% and 17.1%) but about the same as a year ago (4.4% and 4.7%).


Finally, the number of price reductions (4) is down for single family homes compared to the previous period and compared to a year ago (16 and 22 respectively).  It's a mixed picture for condo price reductions which saw 29 price reductions during the past two weeks compared to 16 during the previous period and compared to 33 a year ago.


Monday, July 31, 2017

New Listing Watch -- summer doldrums?


The number of new listings in the past two weeks (108 single family homes and 111 condos) was down noticeably compared to the prior two week period (91 single family homes and 152 condos) and down significantly compared to the same period last year (136 single family homes and 177 condos).

Also worthy of note, the number of new listings of condos and single family homes was approximately equal, something that hasn't happened since the beginning of 2016.

The percentage of those new listings in the last two weeks that went into contract was up compared to the prior period (9.3% vs 7.7% of single family homes and 17.1% vs 3.9% of condos).  Compared to a year ago the percentage of single family homes that went into contract in the same two week period remained virtually the same (9.3% vs 10.3%).  However, there was a significant jump in condos going into contract ( 17.1% vs 9.0%).


The number of price reductions compared to the prior period remained unchanged for single family homes (16) but dropped significantly for condos (16 vs 41).  Compared to the same period last year the number of price reductions dropped in both groups (16 vs 20 single family homes and 16 vs 39 condos).


Monday, July 17, 2017

New Listing Report - Summer Doldrums

New listings for the past two weeks jumped back up to more normal levels. There were 243 new listings (91 single family homes and 152 condos) compared to 158 (62 single family homes and 96 condos) during the previous two weeks and compared to 313 (136 single family homes and 177 condos) a year ago.

However, new listings are still running well below levels in 2016 and 2015.


The number of price reductions increased somewhat compared to the previous period (16 single family homes vs 14 and 41 condos vs 31).  Compared to a year ago price reductions are stable (57 vs 59 a year ago).


San Francisco 6 month review

Is the San Francisco real estate market one of the most expensive places to buy property?  After a review and analysis of the first six months of 2017 activity you can decide for yourself. 
First a few general data points.  42% of closed residential transactions were single family homes; 58% were condominiums/TICs/co-ops. 
Over 67% of residential sales have a sales price over $1million.  Available inventory is at a seven year low.  In 2010 at the beginning of July there were about 1,106 residential properties (single family homes and condos/TICs/co-ops) on the market.  At the beginning of July 2017 there were only 330.   When compared against typical monthly sales volume, this represents about three weeks of inventory for single family homes and four to seven weeks for condos.
When broken down into price ranges the single largest category of sales is the $1million to $1.5million range at 33%. Then comes the $800k to $999k range at 17.4% followed by $1.5million to $2million at 16.4%.  At the extremes of our market the $0 to $500k range accounts for only 2.2%.  The $2million to $2.5million range has 6.6% and the over $2.5million range accounts for 10.6%.
Looking at the five most popular residential configurations for more clarity, we track 3/2 and 2/1 (bedrooms/baths) single family homes, and in the condo category 1/1, 2/1 and 2/2 (bedrooms/baths). 
Property type**
# of sales
Average sale price (000s)
Low sale price (000s) ***
High sale price (000s)
Average days on market
Sale price premium*
Available inventory
2/1 single family
183
$1,067
$491
$2,513
42
121%
3 weeks
3/2 single family
189
$1,454
$659
$3,700
20
115%
3 weeks
1/1 condo
336
$791
$223
$1,570
34
105%
6 weeks
2/1 condo
151
$1,092
$342
$1,925
25
114%
4 weeks
2/2 condo
361
$1,342
$250
$3,055
33
106%
7  weeks

*Sale price divided by listing price.
** These five categories represent about 51% of the total residential sales as reported in the San Francisco Association of Realtors MLS.  Most new construction condo units being sold by the developer do not appear in the MLS. 
*** Most of the low sale prices were properties that have their original and resale prices restricted through various government programs designed to preserve affordable housing.
Current detailed reports can be found at www.boldsf.com/Statistics
And we do accept agent/broker referrals in San Francisco and surrounding counties.

Link our Blog to Linkedin

Link our blog to Linkedin

Wednesday, July 12, 2017

Overall Trends Affecting the San Francisco Housing Market

Interesting analysis that appeared recently in the Business Insider: "San Francisco Housing Market May Have Peaked".

While I disagree with the headline and the metric the author uses to arrive at his conclusion, some of the underlying employment and job growth numbers bear watching.

My biggest disagreement with his "housing market may have peaked" statement is the use of "Federal Housing Finance Agency House Price Index" which is based on mortgages that lenders sell to Fannie Mae and Freddie Mac.  Those mortgages are capped at $636,000.  Assuming 20% down, that mortgage would support a sale of $795,000.

We know that average home prices in San Francisco are well above that figure.  Only 15% of sales this year have been under $799,000 (see our Sales by Price Range report).   So his conclusion is based on data that ignores 85% of the market.

Nevertheless, the slow down in job growth and labor force are worth keeping in mind.

Sales Are Up but Inventory is Down -- what's going on?

For the first half of 2017 the number of residential sales recorded by the San Francisco MLS is up almost 9% compared to the first half of last year -- 2,533 vs 2,332. 


That's the busiest first half since 2014.

But looking at active listings during the first week of each month it is clear that listings are not keeping pace with sales.

This graph shows active listings at the beginning of each month for years 2010 through2019.  Each year follows roughly the same month-to-month pattern -- low numbers in January building to a peak in May/June followed by a lull in July/August followed by another peak in October and then falling off through the end of the year.  The last three or four years active listings have been very low compared to the four previous years.


This trend can be seen on a monthly basis.  Here we show the number of active listings by the five categories of single family homes and condos we track.


Single family homes (both 3/2 and 2/1)and 2/1 condos show the fewest listings while 1/1 and 2/2 condos have significantly more.